Airtran 2006 Annual Report Download - page 68
Download and view the complete annual report
Please find page 68 of the 2006 Airtran annual report below. You can navigate through the pages in the report by either clicking on the pages listed below, or by using the keyword search tool below to find specific information within the annual report.-
 1
1 -
2
-
3
-
4
-
5
-
6
-
7
-
8
-
9
-
10
-
11
-
12
-
13
-
14
-
15
-
16
-
17
-
18
-
19
-
20
-
21
-
22
-
23
-
24
-
25
-
26
-
27
-
28
-
29
-
30
-
31
-
32
-
33
-
34
-
35
-
36
-
37
-
38
-
39
-
40
-
41
-
42
-
43
-
44
-
45
-
46
-
47
-
48
-
49
-
50
-
51
-
52
-
53
-
54
-
55
-
56
-
57
-
 58
58 -
 59
59 -
 60
60 -
 61
61 -
 62
62 -
 63
63 -
 64
64 -
 65
65 -
 66
66 -
 67
67 -
 68
68 -
 69
69
 |
 |
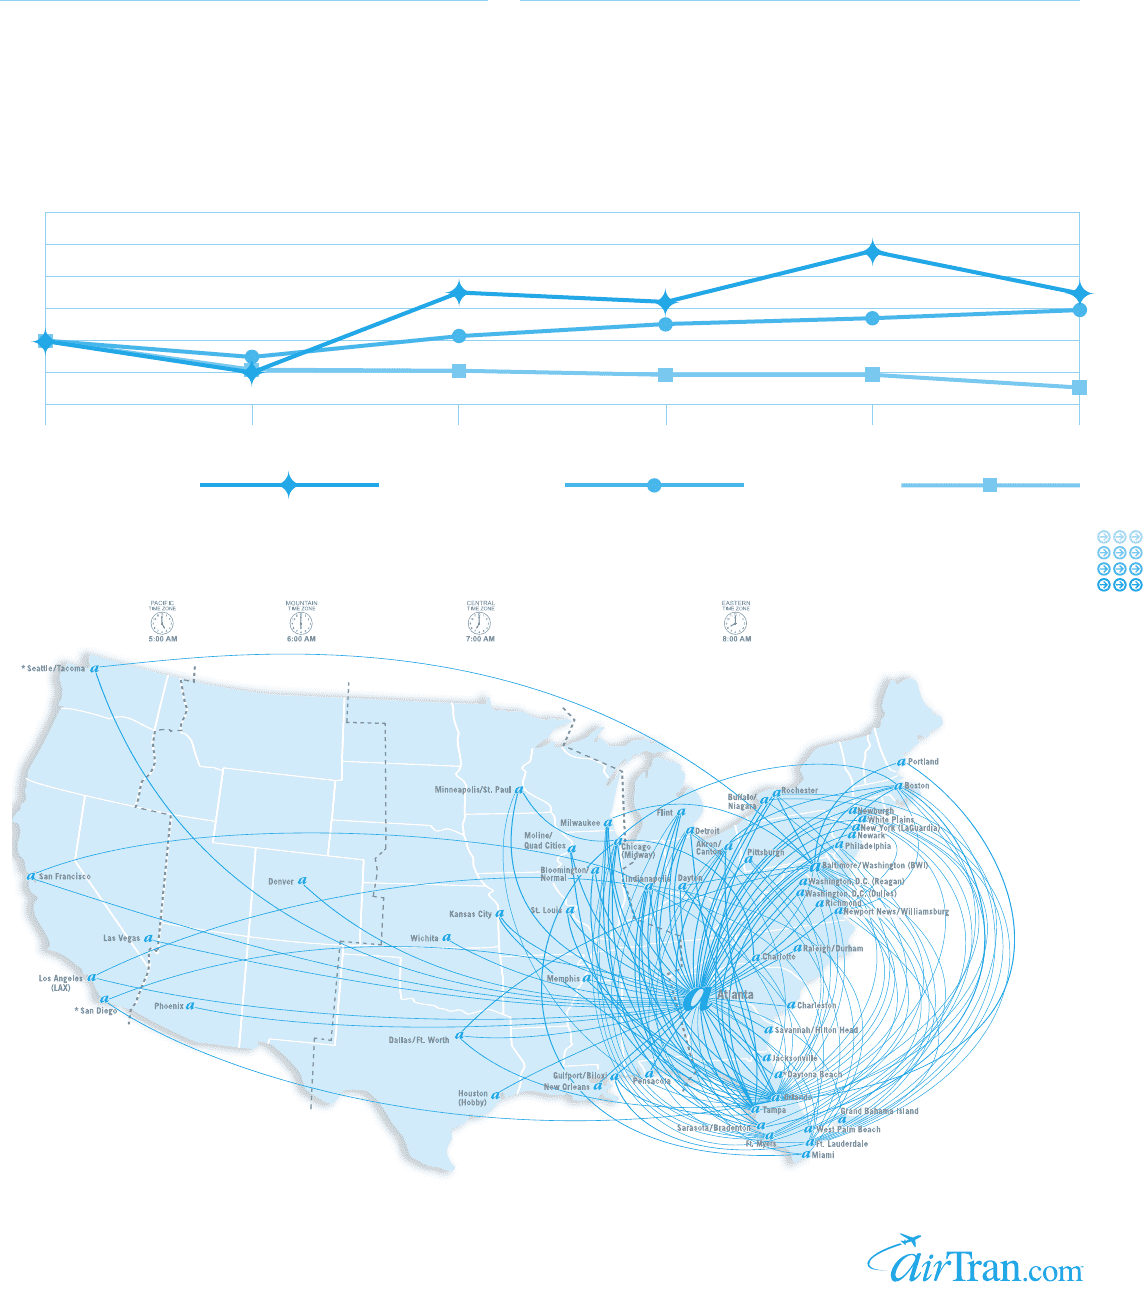
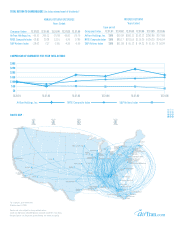
ROUTE MAP :
For schedules, go to airtran.com.
Effective June 29, 2007
Routes and cities subject to change without notice.
Some nonstop routes indicated operate seasonally and/or less than daily.
*Daytona Beach, San Diego and Seattle/Tacoma are served seasonally.
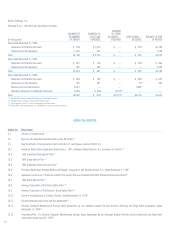
TOTAL RETURN TO SHAREHOLDERS (Includes reinvestment of dividends) :
ANNUAL RETURN PERCENTAGE
Years Ended
Company / Index 12.31.02 12.31.03 12.31.04 12.31.05 12.31.06
AirTran Holdings,Inc. -40.91 205.13 -10.08 49.81 -26.76
NYSE Composite Index -19.83 29.28 12.16 6.95 17.86
S&P Airlines Index -38.42 7.37 -2.86 -4.95 -6.65
INDEXED RETURNS
Years Ended
base period
Company / Index 12.31.01 12.31.02 12.31.03 12.31.04 12.31.05 12.31.06
AirTran Holdings, Inc. $100 $59.09 $180.13 $162.12 $242.88 $177.88
NYSE Composite Index $100 $80.17 $103.65 $116.25 $124.25 $146.54
S&P Airlines Index $100 $61.58 $ 66.12 $ 64.23 $ 61.05 $ 56.99
12.31.01 12.31.02 12.31.03 12.31.04 12.31.05 12.31.06
AirTran Holdings, Inc. NYSE Composite Index S&P Airlines Index
COMPARISON OF CUMULATIVE FIVE YEAR TOTAL RETURN :
$300
$250
$200
$150
$100
$50
$0