Airtran 2006 Annual Report Download - page 27
Download and view the complete annual report
Please find page 27 of the 2006 Airtran annual report below. You can navigate through the pages in the report by either clicking on the pages listed below, or by using the keyword search tool below to find specific information within the annual report.-
 1
1 -
2
-
3
-
4
-
5
-
6
-
7
-
8
-
9
-
10
-
11
-
12
-
13
-
14
-
15
-
16
-
 17
17 -
 18
18 -
 19
19 -
 20
20 -
 21
21 -
 22
22 -
 23
23 -
 24
24 -
 25
25 -
 26
26 -
 27
27 -
 28
28 -
 29
29 -
 30
30 -
 31
31 -
 32
32 -
 33
33 -
 34
34 -
 35
35 -
 36
36 -
 37
37 -
38
-
39
-
40
-
41
-
42
-
43
-
44
-
45
-
46
-
47
-
48
-
49
-
50
-
51
-
52
-
53
-
54
-
55
-
56
-
57
-
58
-
59
-
60
-
61
-
62
-
63
-
64
-
65
-
66
-
67
-
68
-
69
 |
 |

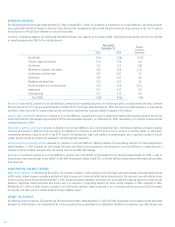
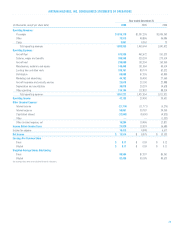
Salaries, wages and benefits
decreased 4.2 percent on a cost per ASM basis, primarily due to gains in productivity driven by the increased number of aircraft and
higher daily utilization. We employed approximately 7,400 full-time equivalent employees as of December 31, 2006, representing a 10.6% percent increase over the
comparable period in 2005.
Maintenance, materials and repairs
increased 19.7 percent on a cost per ASM basis. On a cost per block hour basis, maintenance materials and repairs expense
increased 21.1 percent to $322 per block hour primarily due to the expiration of warranties on the B717 aircraft and an increase in B717 engine maintenance
contract rates. As the original manufacturer warranties expire on our B717 and B737 aircraft, the maintenance, repair and overhaul of aircraft engines and a
significant number of aircraft systems become covered by maintenance agreements with FAA-approved maintenance, repair and overhaul providers. Under certain
of our maintenance agreements, we pay monthly charges based on either the number of flight hours flown or the number of landings.
Distribution
costs decreased 15.9 percent on a cost per ASM basis reflecting the new rates in our GDS agreements that were renegotiated during the fourth quarter
2005. For the year ended December 31, 2006, approximately 60 percent of our sales were made via our internal website. We recognize significant cost savings when
our sales are booked directly through our website compared with more traditional methods, such as travel agent systems (GDS).
Marketing and advertising
costs were unchanged on a cost per ASM basis. The year ended December 31, 2006 included expense of $4.1 million related to a fourth
quarter 2005 barter transaction. The 2006 expense was due to changes in the estimated volume of travel exchanged in connection with the 2005 promotion. The
year ended December 31, 2005 included $4.6 million expense related to this barter transaction.
Aircraft insurance and security services
decreased 6.7 percent on a cost per ASM basis. While the addition of 22 new Boeing aircraft to our fleet during the year
ended December 31, 2006 increased our total insured hull value and related insurance premiums, the decrease on a cost per ASM basis is primarily due to a
reduction in hull and liability insurance rates and security costs for our 2006 fleet coverage.
Depreciation
increased 23.1 percent on a cost per ASM basis, primarily due to the addition of 13 owned B737 for the year ended December 31, 2006 as well as the
purchase of spare aircraft parts for the new B737 fleet. Additionally, during the year ended December 31, 2006 we charged depreciation expense $1.6 million for
property and equipment no longer in use.
Other operating expense
decreased 4.1 percent on a cost per ASM basis. The decrease is attributable in large part to the favorable $3.2 million impact of claim
settlements with vendors recognized during the year ended December 31, 2006.
NONOPERATING (INCOME) EXPENSE :
Other (income) expense, net
increased by $5.7 million. Higher invested cash balances along with higher interest rates increased interest income by $9.9 million.
Interest expense, including amortization of debt issuance costs, increased by $20.1 million primarily due to the effect of aircraft debt financings entered into during
2005 and 2006. Capitalized interest increased by $4.4 million due to increased deposits on future aircraft deliveries. Capitalized interest represents the interest
cost to finance purchase deposits for future aircraft. These amounts are classified as part of the cost of the aircraft upon delivery.
INCOME TAX EXPENSE :
Our effective income tax rate was 40.2 percent and 38.0 percent for the years ended December 31, 2006 and 2005, respectively. Our tax expense for 2005 includes
a one-time benefit of $1.7 million resulting from an adjustment to our deferred tax liabilities due to a decrease in our state effective rate. The overall rate increase
resulted primarily from a combination of the $1.7 million 2005 benefit and 2006 permanent differences related to stock based compensation.
2005 COMPARED TO 2004 :
SUMMARY :
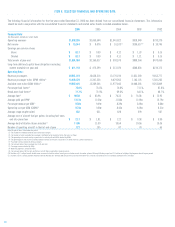
We reported operating income of $23.5 million, net income of $8.1 million and diluted earnings per common share of $0.09 for the year ended December 31, 2005.
For the comparative period in 2004, we reported operating income of $29.5 million, net income of $10.1 million, and diluted earnings per common share of $0.11.
The 2004 results included $1.3 million in other income (expense), primarily related to payment of a break-up fee paid to us in connection with our unsuccessful
bid for certain leased gates and other assets of another airline at Chicago’s Midway airport and $1.5 million of additional operating expense relating to correction
of fuel expense for prior periods. The fuel adjustment was deemed to not be material to the previously issued financial statements and the cumulative adjustment
was not material to our 2004 operating results.
OPERATING REVENUES :
Our operating revenues for the year ended December 31, 2005 increased $409.1 million (39.3 percent), primarily due to a 39.0 percent increase in passenger revenues.
The increase in passenger revenues was largely due to a 33.3 percent increase in passenger traffic, as measured by RPMs, and an increase in our average yield per
RPM of 4.2 percent to 12.36 cents. The increase in yield resulted primarily from a 10.0 percent increase in our average fare to $83.98. This increase in yield, when
combined with our 2.7 percentage point increase in passenger load factor, resulted in an 8.3 percent increase in passenger unit revenues or RASM to 9.09 cents.
During the year ended December 31, 2005, we took delivery of six B717 aircraft and 12 B737 aircraft. As a result, our capacity, as measured by ASMs, increased
28.3 percent. Our traffic, as measured by RPMs, increased 33.3 percent, resulting in a 2.7 percentage point increase in passenger load factor to 73.5 percent.
21