Airtran 2006 Annual Report Download - page 26
Download and view the complete annual report
Please find page 26 of the 2006 Airtran annual report below. You can navigate through the pages in the report by either clicking on the pages listed below, or by using the keyword search tool below to find specific information within the annual report.-
 1
1 -
2
-
3
-
4
-
5
-
6
-
7
-
8
-
9
-
10
-
11
-
12
-
13
-
14
-
15
-
 16
16 -
 17
17 -
 18
18 -
 19
19 -
 20
20 -
 21
21 -
 22
22 -
 23
23 -
 24
24 -
 25
25 -
 26
26 -
 27
27 -
 28
28 -
 29
29 -
 30
30 -
 31
31 -
 32
32 -
 33
33 -
 34
34 -
 35
35 -
 36
36 -
37
-
38
-
39
-
40
-
41
-
42
-
43
-
44
-
45
-
46
-
47
-
48
-
49
-
50
-
51
-
52
-
53
-
54
-
55
-
56
-
57
-
58
-
59
-
60
-
61
-
62
-
63
-
64
-
65
-
66
-
67
-
68
-
69
 |
 |

The Atlanta hub operation remains the core of our business. As important as Atlanta is in our long-term strategic plan we have also focused on developing new
geographic sources of revenue. This has led to our proposal to acquire Midwest Air Group with the aim of developing a stronger presence in the Midwestern United
States. While there can be no assurance that our offer will be accepted, we remain convinced that a combination of AirTran and Midwest Airlines would bring
substantial benefits that would accrue to the shareholders, customers, employees and other stakeholders of both companies.
We will continue to face several challenges during 2007. Managing costs and increasing revenues in the face of high fuel levels will continue to be a primary focus.
Two of our largest competitors are operating in bankruptcy, which creates uncertainty in a number of competitive markets in both the near and long term.
Additionally, if our fuel costs rise, we cannot guarantee that we will be able to raise revenues to match the increased fuel costs. Our financial and operating results
for any prior interim or annual period are not necessarily indicative of those for the entire year. Air travel in our markets tends to be seasonal, with the highest level
of travel occurring during the winter months to Florida and the summer months to the northeastern and western United States. Generally, the second quarter tends
to be our strongest revenue quarter.
RESULTS OF OPERATIONS :
2006 COMPARED TO 2005 :
SUMMARY :
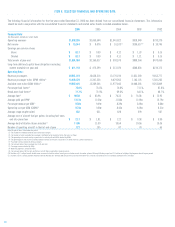
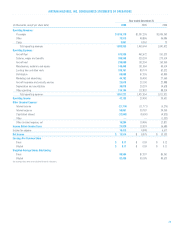
We reported operating income of $42.1 million, net income of $15.5 million and diluted earnings per common share of $0.17 for the year ended December 31, 2006.
For 2005 we reported operating income of $23.5 million, net income of $8.1 million, and diluted earnings per common share of $0.09.
OPERATING REVENUES :
Our operating revenues for year ended December 31, 2006 increased $442.8 million (30.5 percent), primarily due to a 30.0 percent increase in passenger revenues.
The increase in passenger revenues was largely due to a 22.4 percent increase in passenger traffic as measured by revenue passenger miles (RPMs), and an
increase in our average yield per RPM of 6.2 percent to 13.13 cents. The increase in yield resulted primarily from a 7.9 percent increase in our average fare to $90.58.
This increase in yield, when combined with our 0.7 percentage point decrease in passenger load factor, resulted in a 5.2 percent increase in passenger unit revenues
as measured by passenger revenue per available seat mile (RASM) to 9.56 cents.
During the year ended December 31, 2006, we took delivery of two B717 aircraft and 20 B737 aircraft. As a result, our capacity, as measured by available seat
miles (ASMs), increased 23.7 percent. Our traffic, as measured by RPMs, increased 22.4 percent, resulting in a 0.7 percentage point decrease in passenger load
factor to 72.8 percent.
OPERATING EXPENSES :
Our operating expenses for the year ended December 31, 2006 increased $424.2 million (29.7 percent) or 5.0 percent on a cost per ASM basis. Our financial results
were significantly affected by changes in the price of fuel.
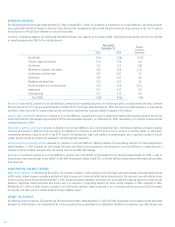
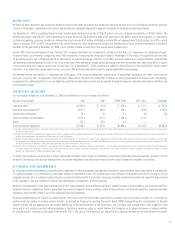
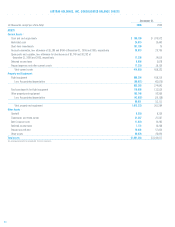
In general, our operating expenses are significantly affected by changes in our capacity, as measured by ASMs. The following table presents our unit costs, defined
as operating expense per ASM, for the indicated periods:
Year ended Percent
December 31, Increase
2006 2005 (Decrease)
Aircraft fuel 3.55¢ 3.01¢ 17.9%
Salaries, wages and benefits 2.05 2.14 (4.2)
Aircraft rent 1.21 1.25 (3.2)
Maintenance, materials and repairs 0.79 0.66 19.7
Landing fees and other rents 0.53 0.53 —
Distribution 0.37 0.44 (15.9)
Marketing and advertising 0.24 0.24 —
Aircraft insurance and security services 0.14 0.15 (6.7)
Depreciation 0.16 0.13 23.1
Other operating 0.70 0.73 (4.1)
Total CASM 9.74¢ 9.28¢ 5.0%
Aircraft fuel
increased 17.9 percent on a cost per ASM basis, primarily due to escalating fuel prices. Our fuel price per gallon, including all fees and taxes, increased
20.0 percent from $1.81 for the year ended December 31, 2005 to $2.17 for the year ended December 31, 2006. The level of our flight operations, as measured by
block hours flown, increased 21.0 percent while our fuel consumption per block hour increased slightly by 0.4 percent to 670 gallons. In a continued effort to reduce
our fuel costs, we have added winglets to 23 of our B737 aircraft. These enhancements extend the aircraft range, improve performance and reduce fuel costs.
20