Air New Zealand 2012 Annual Report Download - page 55
Download and view the complete annual report
Please find page 55 of the 2012 Air New Zealand annual report below. You can navigate through the pages in the report by either clicking on the pages listed below, or by using the keyword search tool below to find specific information within the annual report.-
 1
1 -
2
-
3
-
4
-
5
-
6
-
7
-
8
-
9
-
10
-
11
-
12
-
13
-
14
-
15
-
16
-
17
-
18
-
19
-
20
-
21
-
22
-
23
-
24
-
25
-
26
-
27
-
28
-
29
-
30
-
31
-
32
-
33
-
34
-
35
-
36
-
37
-
38
-
39
-
40
-
41
-
42
-
43
-
44
-
 45
45 -
 46
46 -
 47
47 -
 48
48 -
 49
49 -
 50
50 -
 51
51 -
 52
52 -
 53
53 -
 54
54 -
 55
55 -
 56
56 -
 57
57 -
 58
58 -
 59
59 -
 60
60 -
 61
61 -
 62
62 -
 63
63 -
 64
64 -
 65
65 -
66
-
67
-
68
-
69
-
70
-
71
-
72
-
73
-
74
-
75
-
76
 |
 |

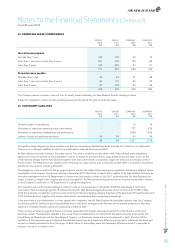
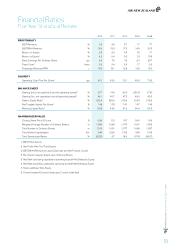
AIR NEW ZEALAND ANNUAL FINANCIAL RESULTS 2012
53
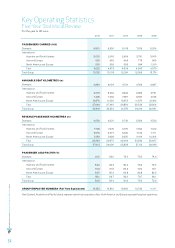
Financial Ratios
Five Year Statistical Review
2012 2 011 2010 2009 2008
PROFITABILITY
EBIT/Revenue % 3.5 2.5 3.7 1.7 7.7
EBITDRA/Revenue % 15.9 15.3 17.5 14.9 20.3
Return on Assets1% 2.9 2.2 3.3 1.5 7.1
Return on Equity2% 4.2 5.4 5.2 1.3 13.8
Basic Earnings Per Ordinary Share cps 6.5 7.5 7.6 2.0 20.7
Fixed Cover3times 2.6 2.4 2.4 1.7 2.9
Passenger Revenue/RPK c 13.5 13.1 12.8 13.8 13.0
LIQUIDITY
Operating Cash Flow Per Share4cps 43.1 43.0 31.1 45.8 70.5
BALANCE SHEET
Gearing (excl. net capitalised aircraft operating leases)5% 21.7 14.4 (9.1) (25.3) (7.2)
Gearing (incl. net capitalised aircraft operating leases)6% 46.1 46.7 47.3 45.0 45.3
Debt to Equity Ratio7% 223.4 225.9 193.6 214.3 218.5
Net Tangible Assets Per Share4$ 1.48 1.33 1.41 1.47 1.45
Working Capital Ratio8% 50.3 44.8 51.2 56.4 55.3
SHAREHOLDER VALUE
Closing Share Price 30 June $ 0.86 1.12 1.07 0.90 1.09
Weighted Average Number of Ordinary Shares m 1,096 1,084 1,073 1,061 1,055
Total Number of Ordinary Shares m 1,100 1,091 1,077 1,065 1,057
Total Market Capitalisation $m 946 1,222 1,152 959 1,152
Total Shareholder Return %(23.2) 4.7 18.9 (17.4) (58.7)
1. EBIT/Total Assets
2. Net Profit After Tax/Total Equity
3. EBITDRA/(Rental and Lease Expenses and Net Finance Costs)
4. Per-share measures based upon Ordinary Shares
5. Net Debt (excluding capitalised operating leases)/Net Debt plus Equity
6. Net Debt (including capitalised operating leases)/Net Debt plus Equity
7. Total Liabilities/Total Equity
8. Current Assets/(Current Assets plus Current Liabilities)