Air New Zealand 2012 Annual Report Download - page 25
Download and view the complete annual report
Please find page 25 of the 2012 Air New Zealand annual report below. You can navigate through the pages in the report by either clicking on the pages listed below, or by using the keyword search tool below to find specific information within the annual report.-
 1
1 -
2
-
3
-
4
-
5
-
6
-
7
-
8
-
9
-
10
-
11
-
12
-
13
-
14
-
 15
15 -
 16
16 -
 17
17 -
 18
18 -
 19
19 -
 20
20 -
 21
21 -
 22
22 -
 23
23 -
 24
24 -
 25
25 -
 26
26 -
 27
27 -
 28
28 -
 29
29 -
 30
30 -
 31
31 -
 32
32 -
 33
33 -
 34
34 -
 35
35 -
36
-
37
-
38
-
39
-
40
-
41
-
42
-
43
-
44
-
45
-
46
-
47
-
48
-
49
-
50
-
51
-
52
-
53
-
54
-
55
-
56
-
57
-
58
-
59
-
60
-
61
-
62
-
63
-
64
-
65
-
66
-
67
-
68
-
69
-
70
-
71
-
72
-
73
-
74
-
75
-
76
 |
 |
AIR NEW ZEALAND ANNUAL FINANCIAL RESULTS 2012
23
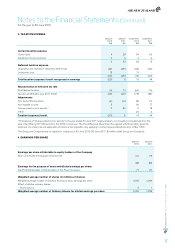
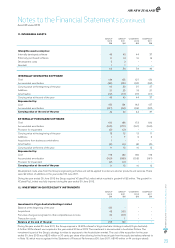
11. INTANGIBLE ASSETS
GROUP
2012
$M
GROUP
2 011
$M
COMPANY
2012
$M
COMPANY
2 011
$M
Intangible assets comprise:
Internally developed software 49 40 44 37
Externally purchased software 11 13 10 12
Development costs 2 2 - -
Goodwill 1 1 - -
63 56 54 49
INTERNALLY DEVELOPED SOFTWARE
Cost 134 125 127 120
Accumulated amortisation (94) (95) (90) (93)
Carrying value at the beginning of the year 40 30 37 27
Additions 21 23 18 21
Amortisation (12) (13) (11) (11)
Carrying value at the end of the year 49 40 44 37
Represented by:
Cost 150 134 143 127
Accumulated amortisation (101) (94) (99) (90)
Carrying value at the end of the year 49 40 44 37
EXTERNALLY PURCHASED SOFTWARE
Cost 180 186 173 180
Accumulated amortisation (165) (172) (161) (169)
Provision for impairment (2) (2) - -
Carrying value at the beginning of the year 13 12 12 11
Additions 1 7 2 6
Acquisitions from business combinations 1 - - -
Amortisation (4) (6) (4) (5)
Carrying value at the end of the year 11 13 10 12
Represented by:
Cost 173 180 165 173
Accumulated amortisation (160) (165) (155) (161)
Provision for impairment (2) (2) - -
Carrying value at the end of the year 11 13 10 12
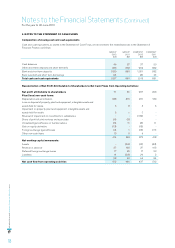
Development costs arise from the Group’s engineering activities and will be applied to external customer products and services. There
were $2 million of additions in the year ended 30 June 2011.
During the year ended 30 June 2012 the Group acquired VCubed Pty Limited which resulted in goodwill of $2 million. The goodwill in
VCubed Pty Limited was fully impaired during the year ended 30 June 2012.
12. INVESTMENT IN QUOTED EQUITY INSTRUMENTS
GROUP
2012
$M
GROUP
2 011
$M
COMPANY
2012
$M
COMPANY
2 011
$M
Investment in Virgin Australia Holdings Limited
Balance at the beginning of the year 120 - - -
Acquisitions 43 200 - -
Fair value changes recognised in other comprehensive income 40 (81) - -
Transaction costs - 1 - -
Balance at the end of the year 203 120 - -
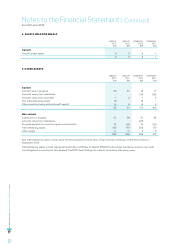
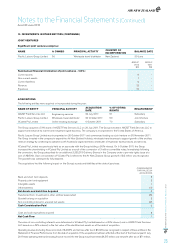
During the year ended 30 June 2011, the Group acquired a 14.99% interest in Virgin Australia Holdings Limited (Virgin Australia).
A further 3.5% interest was acquired in the year ended 30 June 2012. The investment is denominated in Australian Dollars. The
investment is part of the Group’s strategy to widen its exposure to the Australasian market. The cost of the acquisition for the year
ended 30 June 2012 was A$23 million or 30 cents per share after allowing for the financial gain from the equity derivatives referred to
in Note 18, which was recognised in the Statement of Financial Performance (30 June 2011: A$145 million or 44 cents per share).
Notes to the Financial Statements (Continued)
As at 30 June 2012