Air New Zealand 2012 Annual Report Download - page 20
Download and view the complete annual report
Please find page 20 of the 2012 Air New Zealand annual report below. You can navigate through the pages in the report by either clicking on the pages listed below, or by using the keyword search tool below to find specific information within the annual report.-
 1
1 -
2
-
3
-
4
-
5
-
6
-
7
-
8
-
9
-
 10
10 -
 11
11 -
 12
12 -
 13
13 -
 14
14 -
 15
15 -
 16
16 -
 17
17 -
 18
18 -
 19
19 -
 20
20 -
 21
21 -
 22
22 -
 23
23 -
 24
24 -
 25
25 -
 26
26 -
 27
27 -
 28
28 -
 29
29 -
 30
30 -
31
-
32
-
33
-
34
-
35
-
36
-
37
-
38
-
39
-
40
-
41
-
42
-
43
-
44
-
45
-
46
-
47
-
48
-
49
-
50
-
51
-
52
-
53
-
54
-
55
-
56
-
57
-
58
-
59
-
60
-
61
-
62
-
63
-
64
-
65
-
66
-
67
-
68
-
69
-
70
-
71
-
72
-
73
-
74
-
75
-
76
 |
 |

AIR NEW ZEALAND ANNUAL FINANCIAL RESULTS 2012
18
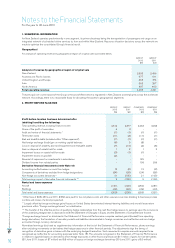
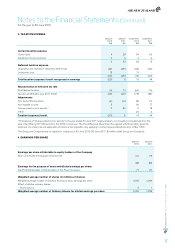
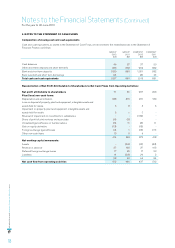
5. NOTES TO THE STATEMENT OF CASH FLOWS
Composition of closing cash and cash equivalents
Cash and cash equivalents, as stated in the Statement of Cash Flows, are reconciled to the related balances in the Statement of
Financial Position as follows:
GROUP
2012
$M
GROUP
2 011
$M
COMPANY
2012
$M
COMPANY
2 011
$M
Cash balances 46 27 37 20
Other short term deposits and short term bills 983 833 984 832
Bank and short term deposits 1,029 860 1,021 852
Bank overdraft and short term borrowings (2) - (6) (1)
Total cash and cash equivalents 1,027 860 1,015 851
Reconciliation of Net Profit Attributable to Shareholders to Net Cash Flows from Operating Activities:
Net profit attributable to shareholders 71 81 287 223
Plus/(less) non-cash items:
Depreciation and amortisation 348 316 231 189
Loss on disposal of property, plant and equipment, intangible assets and
assets held for resale
6
8
3
6
Impairment on property, plant and equipment, intangible assets and
assets held for resale 5 1 7 -
Reversal of impairment on investments in subsidiaries - - (129) -
Share of profit of joint ventures and associates (6) (3) - -
Unrealised (gains)/losses on fuel derivatives (6) 11 (6) 11
Gain on equity derivative (13) - (13) -
Foreign exchange (gains)/losses (4) 1 (13) (11)
Other non-cash items 13 9 6 -
414 424 373 418
Net working capital movements:
Assets - (53) (10) (33)
Revenue in advance 27 108 37 105
Deferred foreign exchange losses 17 20 17 20
Liabilities 14 (33) 20 2
58 42 64 94
Net cash flow from operating activities 472 466 437 512
Notes to the Financial Statements (Continued)
For the year to 30 June 2012