Air New Zealand 2012 Annual Report Download - page 41
Download and view the complete annual report
Please find page 41 of the 2012 Air New Zealand annual report below. You can navigate through the pages in the report by either clicking on the pages listed below, or by using the keyword search tool below to find specific information within the annual report.-
 1
1 -
2
-
3
-
4
-
5
-
6
-
7
-
8
-
9
-
10
-
11
-
12
-
13
-
14
-
15
-
16
-
17
-
18
-
19
-
20
-
21
-
22
-
23
-
24
-
25
-
26
-
27
-
28
-
29
-
30
-
 31
31 -
 32
32 -
 33
33 -
 34
34 -
 35
35 -
 36
36 -
 37
37 -
 38
38 -
 39
39 -
 40
40 -
 41
41 -
 42
42 -
 43
43 -
 44
44 -
 45
45 -
 46
46 -
 47
47 -
 48
48 -
 49
49 -
 50
50 -
 51
51 -
52
-
53
-
54
-
55
-
56
-
57
-
58
-
59
-
60
-
61
-
62
-
63
-
64
-
65
-
66
-
67
-
68
-
69
-
70
-
71
-
72
-
73
-
74
-
75
-
76
 |
 |

AIR NEW ZEALAND ANNUAL FINANCIAL RESULTS 2012
39
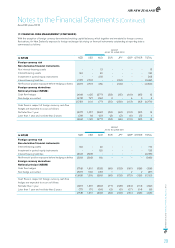
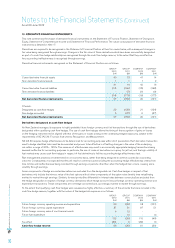
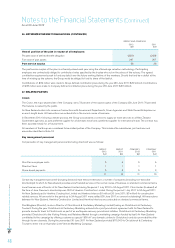
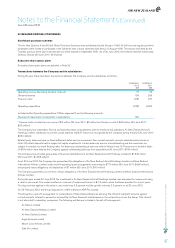
21. DEFERRED TAXATION
Deferred tax assets and liabilities are attributable to the following:
NON-
AIRCRAFT
ASSETS
$M
AIRCRAFT
RELATED
$M
PROVISIONS
AND
ACCRUALS
$M
DERIVATIVE
FINANCIAL
INSTRUMENTS
$M
UNUSED TAX
LOSSES
$M
TAX RATE
CHANGE*
$M
TOTAL
$M
GROUP
As at 1 July 2010
27 301 (81) 3 -(15) 235
Amounts recognised in equity
- - - (29) - - (29)
Amounts recognised in earnings
3 22 - - - - 25
As at 30 June 2011
30 323 (81) (26) -(15) 231
Amounts recognised in equity
- - - 37 - - 37
Amounts recognised in earnings
(5) 23 9 - (13) 15 29
As at 30 June 2012
25 346 (72) 11 (13) - 297
COMPANY
As at 1 July 2010
23 198 (80) 4 -(8) 137
Amounts recognised in equity
- - - (33) - - (33)
Amounts recognised in earnings
1 27 1 - - - 29
As at 30 June 2011
24 225 (79) (29) -(8) 133
Amounts recognised in equity
- - - 38 - - 38
Amounts recognised in earnings
(3) 19 8 - (13) 8 19
As at 30 June 2012
21 244 (71) 9 (13) - 190
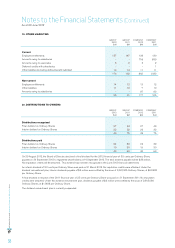
* The New Zealand corporate income tax rate reduced from 30% to 28% at the commencement of the 2012 income year.
Deferred tax assets and liabilities are offset on the face of the Statement of Financial Position where they relate to entities within the
same taxation authority.
Unused tax losses of $48 million (30 June 2011: nil) are available to carry forward against future taxable profits.
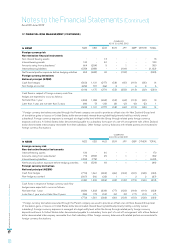
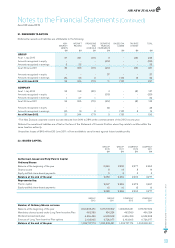
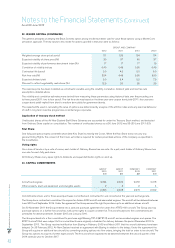
22. ISSUED CAPITAL
GROUP
2012
$M
GROUP
2 011
$M
COMPANY
2012
$M
COMPANY
2 011
$M
Authorised, Issued and Fully Paid in Capital
Ordinary Shares
Balance at the beginning of the year 2,269 2,252 2,277 2,260
Shares issued 8 14 8 14
Equity-settled share-based payments 5 3 5 3
Balance at the end of the year 2,282 2,269 2,290 2,277
Represented by:
Paid in capital 2,267 2,259 2,275 2,267
Equity-settled share-based payments 15 10 15 10
2,282 2,269 2,290 2,277
GROUP
2012
GROUP
2 011
COMPANY
2012
COMPANY
2 011
Number of Ordinary Shares on issue
Balance at the beginning of the year 1,090,833,451 1,076,747, 302 1,090,833,451 1,076,747, 302
Mandatory shares issued under Long Term Incentive Plan 463,389 456,324 463,389 456,324
Dividend reinvestment plan 6,306,429 6,902,848 6,306,429 6,902,848
Exercise of Long Term Incentive Plan options 2,103,905 6,726,977 2,103,905 6,726,977
Balance at the end of the year 1,099,707,174 1,090,833,451 1,099,707,174 1,090,833,451
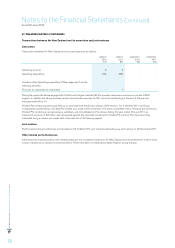
Notes to the Financial Statements (Continued)
As at 30 June 2012