Air New Zealand 2012 Annual Report Download - page 31
Download and view the complete annual report
Please find page 31 of the 2012 Air New Zealand annual report below. You can navigate through the pages in the report by either clicking on the pages listed below, or by using the keyword search tool below to find specific information within the annual report.-
 1
1 -
2
-
3
-
4
-
5
-
6
-
7
-
8
-
9
-
10
-
11
-
12
-
13
-
14
-
15
-
16
-
17
-
18
-
19
-
20
-
 21
21 -
 22
22 -
 23
23 -
 24
24 -
 25
25 -
 26
26 -
 27
27 -
 28
28 -
 29
29 -
 30
30 -
 31
31 -
 32
32 -
 33
33 -
 34
34 -
 35
35 -
 36
36 -
 37
37 -
 38
38 -
 39
39 -
 40
40 -
 41
41 -
42
-
43
-
44
-
45
-
46
-
47
-
48
-
49
-
50
-
51
-
52
-
53
-
54
-
55
-
56
-
57
-
58
-
59
-
60
-
61
-
62
-
63
-
64
-
65
-
66
-
67
-
68
-
69
-
70
-
71
-
72
-
73
-
74
-
75
-
76
 |
 |

AIR NEW ZEALAND ANNUAL FINANCIAL RESULTS 2012
29
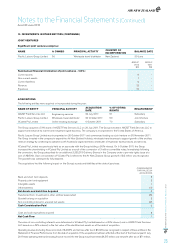
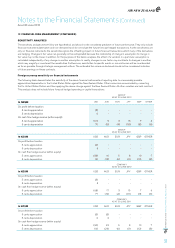
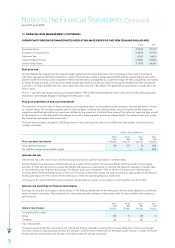
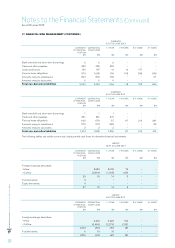
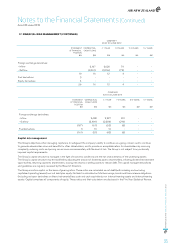
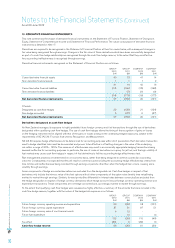
17. FINANCIAL RISK MANAGEMENT (CONTINUED)
With the exception of foreign currency denominated working capital balances, which together are immaterial to foreign currency
fluctuations, Air New Zealand’s exposure to foreign exchange risk arising on financial instruments outstanding at reporting date is
summarised as follows:
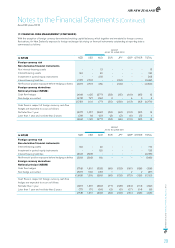
GROUP
AS AT 30 JUNE 2012
In NZ$M NZD USD AUD EUR JPY GBP OTHER TOTAL
Foreign currency risk
Non-derivative financial instruments
Non interest-bearing assets - - 13 - - - - 13
Interest-bearing assets 140 - 40 - - - - 180
Investment in quoted equity instruments - - 203 - - - - 203
Interest-bearing liabilities (747) (751) - - (194) - - (1,692)
Net financial position exposure before hedging activities (607) (751) 256 - (194) - - (1,296)
Foreign currency derivatives
Notional principal (NZ$M)
Cash flow hedges (496) 1,125 (277) (58) (65) (119 ) (95) 15
Non-hedge accounted (678) 727 (56) 3 - 6 3 5
(1,781) 1,101 (77) (55) (259) (113) (92) (1,276)
Cash flows in respect of foreign currency cash flow
hedges are expected to occur as follows:
Not later than 1 year (457) 1,057 (265) (55) (63) (113 ) (90) 14
Later than 1 year and not later than 2 years (39) 68 (12) (3) (2) (6) (5) 1
(496) 1,125 (277) (58) (65) (119 ) (95) 15
GROUP
AS AT 30 JUNE 2011
In NZ$M NZD USD AUD EUR JPY GBP OTHER TOTAL
Foreign currency risk
Non-derivative financial instruments
Interest-bearing assets 130 - 40 - - - - 170
Investment in quoted equity instruments - - 120 - - - - 120
Interest-bearing liabilities (660) (595) - - - - - (1,255)
Net financial position exposure before hedging activities (530) (595) 160 - - - - (965)
Foreign currency derivatives
Notional principal (NZ$M)
Cash flow hedges (758) 1,551 (393) (86) (133) (181) (128) (128)
Non-hedge accounted (567) 560 (35) 1 - 2 2 (37)
(1,855) 1,516 (268) (85) (133) (179) (126) (1,130)
Cash flows in respect of foreign currency cash flow
hedges are expected to occur as follows:
Not later than 1 year (681) 1,381 (339) (77) (128) (164) (114 ) (122)
Later than 1 year and not later than 2 years (77) 170 (54) (9) (5) (17) (14) (6)
(758) 1, 551 (393) (86) (133) (181) (128) (128)
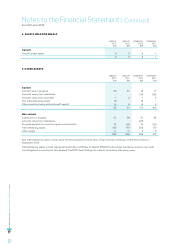
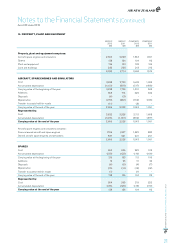
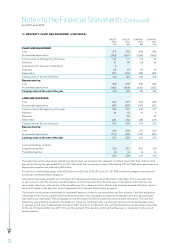
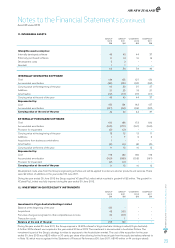
Notes to the Financial Statements (Continued)
As at 30 June 2012