Air New Zealand 2012 Annual Report Download - page 53
Download and view the complete annual report
Please find page 53 of the 2012 Air New Zealand annual report below. You can navigate through the pages in the report by either clicking on the pages listed below, or by using the keyword search tool below to find specific information within the annual report.-
 1
1 -
2
-
3
-
4
-
5
-
6
-
7
-
8
-
9
-
10
-
11
-
12
-
13
-
14
-
15
-
16
-
17
-
18
-
19
-
20
-
21
-
22
-
23
-
24
-
25
-
26
-
27
-
28
-
29
-
30
-
31
-
32
-
33
-
34
-
35
-
36
-
37
-
38
-
39
-
40
-
41
-
42
-
 43
43 -
 44
44 -
 45
45 -
 46
46 -
 47
47 -
 48
48 -
 49
49 -
 50
50 -
 51
51 -
 52
52 -
 53
53 -
 54
54 -
 55
55 -
 56
56 -
 57
57 -
 58
58 -
 59
59 -
 60
60 -
 61
61 -
 62
62 -
 63
63 -
64
-
65
-
66
-
67
-
68
-
69
-
70
-
71
-
72
-
73
-
74
-
75
-
76
 |
 |

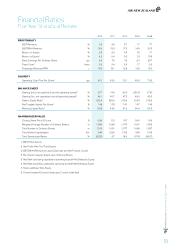
AIR NEW ZEALAND ANNUAL FINANCIAL RESULTS 2012
51
2012
$M
2 011
$M
2010
$M
2009
$M
2008
$M
Operating Revenue
Passenger revenue 3,634 3,525 3,305 3,734 3,808
Cargo 298 278 255 374 416
Contract services 316 329 322 331 287
Other revenue 235 209 164 170 156
4,483 4, 341 4,046 4,609 4,667
Operating Expenditure
Labour (1,050) (1,034) (976) (1,019) (966)
Fuel (1,219) (1,084) (939) (1,687) (1,122)
Maintenance (303) ( 311) (326) (327) (247)
Aircraft operations (390) (381) (369) (423) (412)
Passenger services (233) (242) (240) (275) (254)
Sales and marketing (270) (274) (261) (295) (330)
Foreign exchange (losses)/gains (68) (118) 6366 (128)
Other expenses (235) (234) (233) (261) (261)
(3,768) (3,678) (3,338) (3,921) (3,720)
Earnings Before Finance Costs, Depreciation, Amortisation,
Rental Expenses and Taxation
715 663
708
688
947
Depreciation and amortisation (348) (316) (294) (276) (318)
Rental and lease expenses (209) (238) (263) (334) (270)
Earnings Before Finance Costs and Taxation 158 109 151 78 359
Finance income 31 36 43 98 117
Finance costs (95) (72) (71) (169) (172)
Profit Before Taxation 94 73 123 7 304
Taxation (expense)/credit (23) 8(41) 14 (86)
Net Profit Attributable to Shareholders of Parent Company 71 81 82 21 218
Normalised Earnings Before Taxation* 91 75 137 145 197
Normalised Earnings After Taxation* 69 82 92 118 146
Certain comparatives within the five year statistical review have been reclassified for comparative purposes, to ensure consistency with
the current year.
* Normalised Earnings represents Earnings stated in compliance with New Zealand IFRS after excluding net gains and losses on
derivatives that hedge exposures in other financial periods. Normalised Earnings is a non-IFRS financial performance measure that
aligns the timing of recognition of derivative gains or losses with the underlying hedged transaction. The measure is subject to review
by the Group’s external auditors. Refer to page 2 of the Group’s Financial Statements for a reconciliation to IFRS earnings.
Historical Summary of Financial Performance
Five Year Statistical Review
For the year to 30 June