Air New Zealand 2012 Annual Report Download - page 18
Download and view the complete annual report
Please find page 18 of the 2012 Air New Zealand annual report below. You can navigate through the pages in the report by either clicking on the pages listed below, or by using the keyword search tool below to find specific information within the annual report.-
 1
1 -
2
-
3
-
4
-
5
-
6
-
7
-
 8
8 -
 9
9 -
 10
10 -
 11
11 -
 12
12 -
 13
13 -
 14
14 -
 15
15 -
 16
16 -
 17
17 -
 18
18 -
 19
19 -
 20
20 -
 21
21 -
 22
22 -
 23
23 -
 24
24 -
 25
25 -
 26
26 -
 27
27 -
 28
28 -
29
-
30
-
31
-
32
-
33
-
34
-
35
-
36
-
37
-
38
-
39
-
40
-
41
-
42
-
43
-
44
-
45
-
46
-
47
-
48
-
49
-
50
-
51
-
52
-
53
-
54
-
55
-
56
-
57
-
58
-
59
-
60
-
61
-
62
-
63
-
64
-
65
-
66
-
67
-
68
-
69
-
70
-
71
-
72
-
73
-
74
-
75
-
76
 |
 |

AIR NEW ZEALAND ANNUAL FINANCIAL RESULTS 2012
16
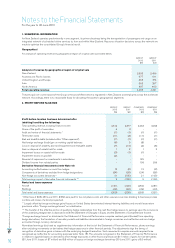
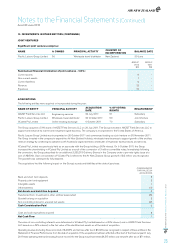
1. SEGMENTAL INFORMATION
Air New Zealand operates predominantly in one segment, its primary business being the transportation of passengers and cargo on an
integrated network of scheduled airline services to, from and within New Zealand. Resource allocation decisions across the network are
made to optimise the consolidated Group’s financial result.
Geographical
An analysis of operating revenue by geographical region of original sale is provided below.
GROUP
2012
$M
GROUP
2 011
$M
Analysis of revenue by geographical region of original sale
New Zealand 2,593 2,496
Australia and Pacific Islands 677 611
United Kingdom and Europe 363 374
Asia 363 397
North America 487 463
Total operating revenue 4,483 4,341
The principal non-current asset of the Group is the aircraft fleet which is registered in New Zealand and employed across the worldwide
network. Accordingly, there is no reasonable basis for allocating the assets to geographical segments.
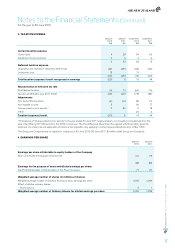
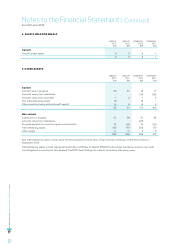
2. PROFIT BEFORE TAXATION
GROUP
2012
$M
GROUP
2 011
$M
COMPANY
2012
$M
COMPANY
2 011
$M
Profit before taxation has been determined after
(debiting)/crediting the following:
Total operating revenue, including finance income 4,514 4,377 4,063 3,993
Share of the profit of associates 6 3 - -
Audit and review of financial statements * (1) (1) (1) (1)
Termination costs (11) (3) (11) (1)
Bad and doubtful debts (included within “Other expenses”) (1) (1) (1) (1)
Net foreign exchange (loss)/gain on working capital balances (8) 9 (8) -
Loss on disposal of property, plant and equipment and intangible assets (7) (10) (4) (8)
Gain on disposal of assets held for resale 1 2 1 2
Impairment losses on assets held for resale (3) (1) (1) -
Impairment losses on goodwill (2) - - -
Reversal of impairment on investments in subsidiaries - - 129 -
Dividend income from related parties - - 198 256
Derivative financial instruments (refer Note 18)
Accounting ineffectiveness on cash flow hedges 12 (3) 12 (3)
Components of derivatives excluded from hedge designations (24) (28) (24) (28)
Non-hedge accounted derivatives ** 21 (105) 21 (105)
Total earnings impact of derivative financial instruments *** 9 (136) 9 (136)
Rental and lease expenses
Aircraft (161) (190) (250) (281)
Buildings (48) (48) (39) (40)
Total rental and lease expenses (209) (238) (289) (321)
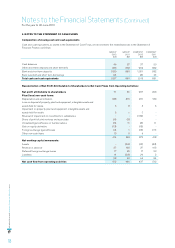
* Other fees of $63k (30 June 2011: $38k) were paid for tax compliance work and other assurance services (relating to business process
controls and review of a bond prospectus).
** Largely offset by foreign exchange gains/losses on United States denominated interest-bearing liabilities and aircraft lease return
provisions within “Foreign exchange losses” as noted below.
*** The transfer of the effective portion of qualifying hedge relationships from the cash flow hedge reserve to earnings upon the occurrence
of the underlying hedged item is disclosed in both the Statement of Changes in Equity and the Statement of Comprehensive Income.
“Foreign exchange losses” as disclosed in the Statement of Financial Performance comprise realised gains/(losses) from operating
hedge derivatives, the translation of monetary assets and liabilities denominated in foreign currencies and ineffective and non-hedge
accounted foreign currency derivatives.
Normalised earnings, disclosed as supplementary information at the foot of the Statement of Financial Performance, shows earnings
after excluding movements on derivatives that hedge exposures in other financial periods. The adjustments align the timing of
recognition of derivative gains or losses with the underlying hedged transaction. Such movements comprise amounts required to be
recognised as ineffective for accounting purposes (refer Note 18). The amounts recognised in the Statement of Financial Performance
in relation to (gains)/losses on derivatives which hedge exposures in other financial periods are $11 million of gains for fuel derivatives
(30 June 2011: losses of $7 million) and $8 million of losses on foreign exchange derivatives (30 June 2011: gains of $5 million).
Notes to the Financial Statements
For the year to 30 June 2012