3M 2013 Annual Report Download - page 78
Download and view the complete annual report
Please find page 78 of the 2013 3M annual report below. You can navigate through the pages in the report by either clicking on the pages listed below, or by using the keyword search tool below to find specific information within the annual report.-
 1
1 -
2
-
3
-
4
-
5
-
6
-
7
-
8
-
9
-
10
-
11
-
12
-
13
-
14
-
15
-
16
-
17
-
18
-
19
-
20
-
21
-
22
-
23
-
24
-
25
-
26
-
27
-
28
-
29
-
30
-
31
-
32
-
33
-
34
-
35
-
36
-
37
-
38
-
39
-
40
-
41
-
42
-
43
-
44
-
45
-
46
-
47
-
48
-
49
-
50
-
51
-
52
-
53
-
54
-
55
-
56
-
57
-
58
-
59
-
60
-
61
-
62
-
63
-
64
-
65
-
66
-
67
-
 68
68 -
 69
69 -
 70
70 -
 71
71 -
 72
72 -
 73
73 -
 74
74 -
 75
75 -
 76
76 -
 77
77 -
 78
78 -
 79
79 -
 80
80 -
 81
81 -
 82
82 -
 83
83 -
 84
84 -
 85
85 -
 86
86 -
 87
87 -
 88
88 -
89
-
90
-
91
-
92
-
93
-
94
-
95
-
96
-
97
-
98
-
99
-
100
-
101
-
102
-
103
-
104
-
105
-
106
-
107
-
108
-
109
-
110
-
111
-
112
-
113
-
114
-
115
-
116
-
117
-
118
-
119
-
120
-
121
-
122
-
123
-
124
-
125
-
126
-
127
-
128
-
129
-
130
-
131
-
132
 |
 |

72
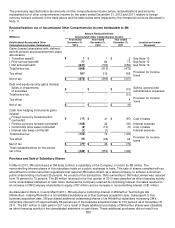
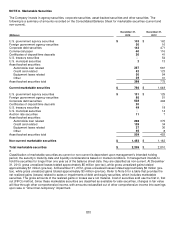
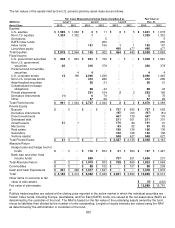
NOTE 8. Marketable Securities
The Company invests in agency securities, corporate securities, asset-backed securities and other securities. The
following is a summary of amounts recorded on the Consolidated Balance Sheet for marketable securities (current and
non-current).
December 31,
December 31,
(Millions)
2013
2012
U.S. government agency securities
$
103
$
162
Foreign government agency securities
30
16
Corporate debt securities
143
471
Commercial paper
60
116
Certificates of deposit/time deposits
20
41
U.S. treasury securities
―
54
U.S. municipal securities
2
13
Asset-backed securities:
Automobile loan related
287
567
Credit card related
52
123
Equipment lease related
30
54
Other
29
31
Asset-backed securities total
398
775
Current marketable securities
$
756
$
1,648
U.S. government agency securities
$
131
$
125
Foreign government agency securities
95
51
Corporate debt securities
638
494
Certificates of deposit/time deposits
20
―
U.S. treasury securities
49
18
U.S. municipal securities
―
14
Auction rate securities
11
7
Asset-backed securities:
Automobile loan related
298
375
Credit card related
128
34
Equipment lease related
37
36
Other
46
8
Asset-backed securities total
509
453
Non
-
current marketable securities
$
1,453
$
1,162
Total marketable securities
$
2,209
$
2,810
Classification of marketable securities as current or non-current is dependent upon management’s intended holding
period, the security’s maturity date and liquidity considerations based on market conditions. If management intends to
hold the securities for longer than one year as of the balance sheet date, they are classified as non-current. At December
31, 2013, gross unrealized losses totaled approximately $5 million (pre-tax), while gross unrealized gains totaled
approximately $1 million (pre-tax). At December 31, 2012, gross unrealized losses totaled approximately $6 million (pre-
tax), while gross unrealized gains totaled approximately $3 million (pre-tax). Refer to Note 5 for a table that provides the
net realized gains (losses) related to sales or impairments of debt and equity securities, which includes marketable
securities. The gross amounts of the realized gains or losses were not material. Cost of securities sold use the first in, first
out (FIFO) method. Since these marketable securities are classified as available-for-sale securities, changes in fair value
will flow through other comprehensive income, with amounts reclassified out of other comprehensive income into earnings
upon sale or “other-than-temporary” impairment.