3M 2013 Annual Report Download - page 21
Download and view the complete annual report
Please find page 21 of the 2013 3M annual report below. You can navigate through the pages in the report by either clicking on the pages listed below, or by using the keyword search tool below to find specific information within the annual report.-
 1
1 -
2
-
3
-
4
-
5
-
6
-
7
-
8
-
9
-
10
-
 11
11 -
 12
12 -
 13
13 -
 14
14 -
 15
15 -
 16
16 -
 17
17 -
 18
18 -
 19
19 -
 20
20 -
 21
21 -
 22
22 -
 23
23 -
 24
24 -
 25
25 -
 26
26 -
 27
27 -
 28
28 -
 29
29 -
 30
30 -
 31
31 -
32
-
33
-
34
-
35
-
36
-
37
-
38
-
39
-
40
-
41
-
42
-
43
-
44
-
45
-
46
-
47
-
48
-
49
-
50
-
51
-
52
-
53
-
54
-
55
-
56
-
57
-
58
-
59
-
60
-
61
-
62
-
63
-
64
-
65
-
66
-
67
-
68
-
69
-
70
-
71
-
72
-
73
-
74
-
75
-
76
-
77
-
78
-
79
-
80
-
81
-
82
-
83
-
84
-
85
-
86
-
87
-
88
-
89
-
90
-
91
-
92
-
93
-
94
-
95
-
96
-
97
-
98
-
99
-
100
-
101
-
102
-
103
-
104
-
105
-
106
-
107
-
108
-
109
-
110
-
111
-
112
-
113
-
114
-
115
-
116
-
117
-
118
-
119
-
120
-
121
-
122
-
123
-
124
-
125
-
126
-
127
-
128
-
129
-
130
-
131
-
132
 |
 |

15
Item 7. Management’s Discussion and Analysis of Financial Condition and Results of Operations.
Management’s Discussion and Analysis of Financial Condition and Results of Operations (MD&A) is designed to provide
a reader of 3M’s financial statements with a narrative from the perspective of management. 3M’s MD&A is presented in
eight sections:
•
Overview
•
Results of Operations
•
Performance by Business Segment
•
Performance by Geographic Area
•
Critical Accounting Estimates
•
New Accounting Pronouncements
•
Financial Condition and Liquidity
•
Financial Instruments
OVERVIEW
3M is a diversified global manufacturer, technology innovator and marketer of a wide variety of products. As described in
Note 15 to the Consolidated Financial Statements, effective in the first quarter of 2013, the Company completed a
realignment of its business segments to better serve global markets and customers. In addition, during the first quarter of
2013, as described in Note 16, 3M realigned its geographic area structure to include Puerto Rico in the United States
rather than in the Latin America/Canada region. Segment and geographic area information presented herein reflects the
impact of these changes for all periods presented. 3M manages its operations in five operating business segments:
Industrial; Safety and Graphics; Electronics and Energy; Health Care; and Consumer. From a geographic perspective,
any references to EMEA refer to Europe, Middle East and Africa on a combined basis.
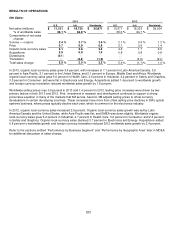
Fourth-quarter 2013 net income attributable to 3M was $1.103 billion, or $1.62 per diluted share, compared to $991
million, or $1.41 per diluted share, in the fourth quarter of 2012. Fourth-quarter 2013 sales totaled $7.6 billion, an increase
of 2.4 percent from the fourth quarter of 2012. 3M achieved organic local-currency sales growth (which includes organic
volume and selling price impacts) in all five of its business segments, led by Industrial. Industrial organic local-currency
sales increased 5.8 percent, led by advanced materials, automotive OEM, 3M Purification Inc. (filtration products),
aerospace, and automotive aftermarket. Organic local-currency sales increased 4.8 percent in Safety and Graphics, led
by roofing granules, personal safety, commercial graphics, and architectural markets. Organic local-currency sales grew
3.6 percent in the Health Care business segment, with the strongest sales growth in health information systems, food
safety, critical and chronic care, and infection prevention; organic local-currency sales declined in drug delivery systems.
Organic local-currency sales increased 1.3 percent in the Consumer business segment, led by the consumer health care
and home care businesses. Electronics and Energy organic local-currency sales growth was 0.4 percent, with increases
in energy-related sales led by renewable energy and electrical markets. Electronic-related sales declined, with growth in
optical systems and electronic solutions more than offset by declines in other businesses. For the Company in total,
organic-local currency sales grew 3.4 percent, with higher organic volumes contributing 2.0 percent and selling price
increases contributing 1.4 percent. Acquisitions added 0.7 percent to sales, which related to the late November 2012
acquisition of Ceradyne, Inc. Foreign currency translation reduced sales by 1.7 percent year-on-year.
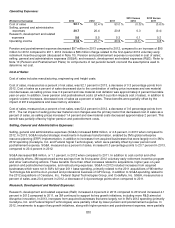
From a geographic area perspective, fourth-quarter 2013 organic local-currency sales growth was 4.5 percent in the
United States, 3.4 percent in EMEA, 3.3 percent in Asia Pacific, and 2.2 percent in Latin America/Canada. In the U.S.,
EMEA, and Asia Pacific, all five business segments generated positive organic local-currency sales growth. Organic local-
currency sales growth in the United States was led by Industrial, and Safety and Graphics. Organic local-currency sales
growth in EMEA was led by Industrial. West Europe grew organically by 3 percent year-on-year, continuing the positive
trends 3M has seen in recent quarters. Organic local-currency sales growth in Asia Pacific was led by Consumer, Safety
and Graphics, and Health Care. Sales in Japan grew 4 percent organically. China/Hong Kong grew organically by 1
percent, impacted by a strong prior-year comparison of 16 percent growth in the fourth quarter of 2012 and weakness in
electronics. Organic local-currency sales growth in Latin America/Canada was positive across most countries, but below
recent trend levels for a few reasons. First, slowing in government tenders for infrastructure projects in certain countries
impacted sales in Electronics and Energy. Consumer was also soft in the fourth quarter due to weak retail demand and
challenging year-on-year comparisons. And lastly, sales in Venezuela declined year-on-year due to the economic and
political situation there. Venezuela diluted fourth-quarter organic sales growth in Latin America/Canada by 1.5 percentage
points, as 3M continues to work towards minimizing its Bolivar exposure and any associated costs.