3M 2013 Annual Report Download - page 25
Download and view the complete annual report
Please find page 25 of the 2013 3M annual report below. You can navigate through the pages in the report by either clicking on the pages listed below, or by using the keyword search tool below to find specific information within the annual report.-
 1
1 -
2
-
3
-
4
-
5
-
6
-
7
-
8
-
9
-
10
-
11
-
12
-
13
-
14
-
 15
15 -
 16
16 -
 17
17 -
 18
18 -
 19
19 -
 20
20 -
 21
21 -
 22
22 -
 23
23 -
 24
24 -
 25
25 -
 26
26 -
 27
27 -
 28
28 -
 29
29 -
 30
30 -
 31
31 -
 32
32 -
 33
33 -
 34
34 -
 35
35 -
36
-
37
-
38
-
39
-
40
-
41
-
42
-
43
-
44
-
45
-
46
-
47
-
48
-
49
-
50
-
51
-
52
-
53
-
54
-
55
-
56
-
57
-
58
-
59
-
60
-
61
-
62
-
63
-
64
-
65
-
66
-
67
-
68
-
69
-
70
-
71
-
72
-
73
-
74
-
75
-
76
-
77
-
78
-
79
-
80
-
81
-
82
-
83
-
84
-
85
-
86
-
87
-
88
-
89
-
90
-
91
-
92
-
93
-
94
-
95
-
96
-
97
-
98
-
99
-
100
-
101
-
102
-
103
-
104
-
105
-
106
-
107
-
108
-
109
-
110
-
111
-
112
-
113
-
114
-
115
-
116
-
117
-
118
-
119
-
120
-
121
-
122
-
123
-
124
-
125
-
126
-
127
-
128
-
129
-
130
-
131
-
132
 |
 |

19
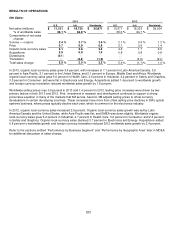
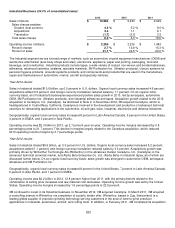
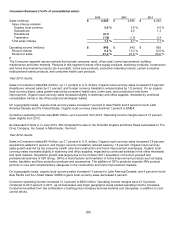
RESULTS OF OPERATIONS
Net Sales:
2013 2012
U.S. Intl. Worldwide U.S. Intl. Worldwide
Net sales (millions)
$
11,151
$
19,720
$
30,871
$
10,571 $
19,333
$
29,904
% of worldwide sales
36.1
%
63.9
%
35.3 %
64.7
%
Components of net sales
change:
Volume
— organic
2.4
%
2.7
%
2.5
%
2.1 %
0.8
%
1.2 %
Price
0.7
0.9
0.9
2.1 0.9
1.4
Organic local-currency sales
3.1
3.6
3.4
4.2 1.7
2.6
Acquisitions
2.5
0.9
1.4
0.8 0.8
0.8
Divestitures
(0.1)
―
―
― ―
―
Translation
―
(2.5)
(1.6)
― (3.6)
(2.4)
Total sales change
5.5
%
2.0
%
3.2
%
5.0 %
(1.1)
%
1.0 %
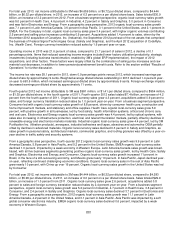
In 2013, organic local-currency sales grew 3.4 percent, with increases of 7.1 percent in Latin America/Canada, 3.6
percent in Asia Pacific, 3.1 percent in the United States, and 2.1 percent in Europe, Middle East and Africa. Worldwide
organic local-currency sales grew 5.0 percent in Health Care, 4.6 percent in Industrial, 4.2 percent in Safety and Graphics,
3.0 percent in Consumer, and were flat in Electronics and Energy. Acquisitions added 1.4 percent to worldwide growth
and foreign currency translation reduced worldwide sales growth by 1.6 percent.
Worldwide selling prices rose 0.9 percent in 2013 and 1.4 percent in 2012. Selling price increases were driven by two
primary factors in both 2013 and 2012. First, investment in research and development continues to support a strong
price/value equation in many of the markets that 3M serves. Second, 3M adjusts selling prices to offset currency
devaluations in certain developing countries. These increases have more than offset selling price declines in 3M’s optical
systems business, where prices typically decline each year, which is common for the electronics industry.
In 2012, organic local-currency sales increased 2.6 percent. Organic local-currency sales growth was led by Latin
America/Canada and the United States, while Asia Pacific was flat, and EMEA was down slightly. Worldwide organic
local-currency sales grew 5.2 percent in Industrial, 4.7 percent in Health Care, 3.6 percent in Consumer, and 2.4 percent
in Safety and Graphics. Organic local-currency sales declined 3.7 percent in Electronics and Energy. Acquisitions added
0.8 percent to worldwide growth and foreign currency translation reduced 2012 worldwide sales growth by 2.4 percent.
Refer to the sections entitled “Performance by Business Segment” and “Performance by Geographic Area” later in MD&A
for additional discussion of sales change.