3M 2013 Annual Report Download - page 5
Download and view the complete annual report
Please find page 5 of the 2013 3M annual report below. You can navigate through the pages in the report by either clicking on the pages listed below, or by using the keyword search tool below to find specific information within the annual report.
3M Technology Advancing Every Company
3M Products Enhancing Every Home
3M Innovation Improving Every Life
Financial Results
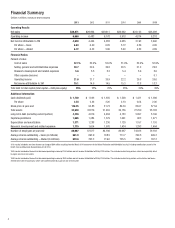
For the year, earnings per share were up 6.3 percent to $6.72.
Operating income was $6.7 billion, a 2.8 percent increase.
Operating income margins remained strong at 21.6 percent, with four of our five business
groups delivering margins above 21 percent.
Sales for the year were $31 billion. In organic local currency terms, sales increased
3.4 percent.
Latin America/Canada led the way with organic growth of 7 percent. Asia Pacific rose
4 percent, the U.S. was up 3 percent and Europe/Middle East/Africa was up 2 percent.
Currency impacts reduced worldwide sales by 1.6 percent, and acquisitions added
1.4 percent.
We returned a record $6.9 billion in cash to shareholders through dividends and share
repurchases.
Finally, free cash flow conversion was 89 percent with ROIC at 20 percent.
Overall, I am very pleased with our progress in 2013. We delivered good broad-based
performance while investing and building for long-term success. We continue to be inspired
and motivated by our vision:
3
Inge G. Thulin
Chairman of the Board, President and Chief Executive Officer
February 13, 2014

