3M 2013 Annual Report Download - page 23
Download and view the complete annual report
Please find page 23 of the 2013 3M annual report below. You can navigate through the pages in the report by either clicking on the pages listed below, or by using the keyword search tool below to find specific information within the annual report.-
 1
1 -
2
-
3
-
4
-
5
-
6
-
7
-
8
-
9
-
10
-
11
-
12
-
 13
13 -
 14
14 -
 15
15 -
 16
16 -
 17
17 -
 18
18 -
 19
19 -
 20
20 -
 21
21 -
 22
22 -
 23
23 -
 24
24 -
 25
25 -
 26
26 -
 27
27 -
 28
28 -
 29
29 -
 30
30 -
 31
31 -
 32
32 -
 33
33 -
34
-
35
-
36
-
37
-
38
-
39
-
40
-
41
-
42
-
43
-
44
-
45
-
46
-
47
-
48
-
49
-
50
-
51
-
52
-
53
-
54
-
55
-
56
-
57
-
58
-
59
-
60
-
61
-
62
-
63
-
64
-
65
-
66
-
67
-
68
-
69
-
70
-
71
-
72
-
73
-
74
-
75
-
76
-
77
-
78
-
79
-
80
-
81
-
82
-
83
-
84
-
85
-
86
-
87
-
88
-
89
-
90
-
91
-
92
-
93
-
94
-
95
-
96
-
97
-
98
-
99
-
100
-
101
-
102
-
103
-
104
-
105
-
106
-
107
-
108
-
109
-
110
-
111
-
112
-
113
-
114
-
115
-
116
-
117
-
118
-
119
-
120
-
121
-
122
-
123
-
124
-
125
-
126
-
127
-
128
-
129
-
130
-
131
-
132
 |
 |

17
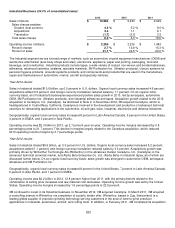
Operating income in 2012 was 21.7 percent of sales, compared to 20.9 percent of sales in 2011, an improvement of 0.8
percentage points. The primary benefit (as discussed in the Results of Operations section) related to the combination of
selling price increases and raw material cost decreases. Currency effects reduced diluted earnings per share by an
estimated 15 cents. Net insurance recoveries in 2012 related to the 2011 earthquake and tsunami in Japan increased
earnings by approximately 4 cents per diluted share. In 2011, the impact of natural disasters, net of insurance recoveries,
reduced earnings by approximately 6 cents per diluted share. Early retirement/restructuring costs for 2012 totaled
approximately 8 cents per diluted share, which included the first quarter 2012 charge of approximately 3 cents per diluted
share related to a voluntary early retirement program in the United States.
The most significant non-operating items that impacted earnings in 2012 when compared to 2011 were diluted shares
outstanding and income taxes. Average diluted shares outstanding declined 2.2 percent in 2012 to 703.3 million, which
increased earnings per diluted share by approximately 14 cents when compared to 2011. The income tax rate for 2012
was 29.0 percent compared to 27.8 percent in 2011, which decreased earnings per diluted share by approximately 11
cents.
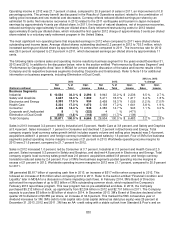
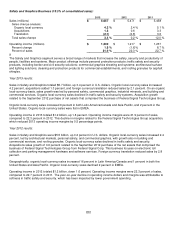
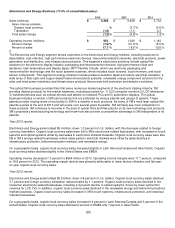
The following table contains sales and operating income results by business segment for the years ended December 31,
2013 and 2012. In addition to the discussion below, refer to the section entitled “Performance by Business Segment” and
“Performance by Geographic Area” later in MD&A for a more detailed discussion of the sales and income results of the
Company and its respective business segments (including Corporate and Unallocated). Refer to Note 15 for additional
information on business segments, including Elimination of Dual Credit.
2013 vs. 2012
2013
2012
% change
Net
% of Oper.
Net
% of Oper.
Net Oper.
(Dollars in millions)
Sales
Total Income
Sales
Total Income
Sales Income
Business Segments
Industrial
$
10,584
34.3
%
$
2,296
$
9,943
33.2
%
$
2,236
6.5 %
2.7
%
Safety and Graphics
5,657
18.3
%
1,239
5,471
18.3
%
1,217
3.4 %
1.8
%
Electronics and Energy
5,393
17.5
%
954
5,458
18.3
%
1,026
(1.2)%
(7.0)
%
Health Care
5,334
17.3
%
1,672
5,138
17.2
%
1,641
3.8 %
1.9
%
Consumer
4,435
14.4
%
945
4,386
14.7
%
943
1.1 %
0.2
%
Corporate and Unallocated
8
―
%
(322)
4
―
%
(471)
― ―
Elimination of Dual Credit
(540)
(1.8)
%
(118)
(496)
(1.7)
%
(109)
― ―
Total Company
$
30,871
100.0
%
$
6,666
$
29,904
100.0
%
$
6,483
3.2 %
2.8
%
Sales in 2013 increased 3.2 percent, led by Industrial at 6.5 percent, Health Care at 3.8 percent, and Safety and Graphics
at 3.4 percent. Sales increased 1.1 percent in Consumer and declined 1.2 percent in Electronics and Energy. Total
company organic local-currency sales growth (which includes organic volume and selling price impacts) was 3.4 percent,
acquisitions added 1.4 percent, and foreign currency translation reduced sales by 1.6 percent. Four of 3M’s five business
segments posted operating income margins in excess of 21 percent in 2013. Worldwide operating income margins for
2013 were 21.6 percent, compared to 21.7 percent for 2012.
Sales in 2012 increased 1.0 percent, led by Consumer at 3.7 percent, Industrial at 3.3 percent and Health Care at 2.5
percent. Sales increased 0.2 percent in Safety and Graphics, and declined 4.8 percent in Electronics and Energy. Total
company organic local-currency sales growth was 2.6 percent, acquisitions added 0.8 percent, and foreign currency
translation reduced sales by 2.4 percent. Four of 3M’s five business segments posted operating income margins in
excess of 21 percent in 2012. Worldwide operating income margins for 2012 were 21.7 percent, compared to 20.9 percent
for 2011.
3M generated $5.817 billion of operating cash flow in 2013, an increase of $517 million when compared to 2012. This
followed an increase of $16 million when comparing 2012 to 2011. Refer to the section entitled “Financial Condition and
Liquidity” later in MD&A for a discussion of items impacting cash flows. In February 2014, 3M’s Board of Directors
authorized the repurchase of up to $12 billion of 3M’s outstanding common stock, which replaced the Company’s
February 2013 repurchase program. This new program has no pre-established end date. In 2013, the Company
purchased $5.212 billion of stock, up significantly from $2.204 billion in 2012 and $2.701 billion in 2011. The Company
expects to purchase $3 billion to $5 billion of stock in 2014. In December 2013, 3M’s Board of Directors declared a first-
quarter 2014 dividend of $0.855 per share, an increase of 34.6 percent. This marked the 56th consecutive year of
dividend increases for 3M. 3M’s debt to total capital ratio (total capital defined as debt plus equity) was 25 percent at
December 31, 2013, 2012 and 2011. 3M has an AA- credit rating with a stable outlook from Standard & Poor’s and an