3M 2013 Annual Report Download - page 35
Download and view the complete annual report
Please find page 35 of the 2013 3M annual report below. You can navigate through the pages in the report by either clicking on the pages listed below, or by using the keyword search tool below to find specific information within the annual report.-
 1
1 -
2
-
3
-
4
-
5
-
6
-
7
-
8
-
9
-
10
-
11
-
12
-
13
-
14
-
15
-
16
-
17
-
18
-
19
-
20
-
21
-
22
-
23
-
24
-
 25
25 -
 26
26 -
 27
27 -
 28
28 -
 29
29 -
 30
30 -
 31
31 -
 32
32 -
 33
33 -
 34
34 -
 35
35 -
 36
36 -
 37
37 -
 38
38 -
 39
39 -
 40
40 -
 41
41 -
 42
42 -
 43
43 -
 44
44 -
 45
45 -
46
-
47
-
48
-
49
-
50
-
51
-
52
-
53
-
54
-
55
-
56
-
57
-
58
-
59
-
60
-
61
-
62
-
63
-
64
-
65
-
66
-
67
-
68
-
69
-
70
-
71
-
72
-
73
-
74
-
75
-
76
-
77
-
78
-
79
-
80
-
81
-
82
-
83
-
84
-
85
-
86
-
87
-
88
-
89
-
90
-
91
-
92
-
93
-
94
-
95
-
96
-
97
-
98
-
99
-
100
-
101
-
102
-
103
-
104
-
105
-
106
-
107
-
108
-
109
-
110
-
111
-
112
-
113
-
114
-
115
-
116
-
117
-
118
-
119
-
120
-
121
-
122
-
123
-
124
-
125
-
126
-
127
-
128
-
129
-
130
-
131
-
132
 |
 |

29
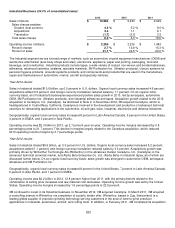
Consumer Business (14.4% of consolidated sales):
2013 2012 2011
Sales (millions)
$
4,435
$
4,386
$
4,230
Sales change analysis:
Organic local currency
3.0
%
3.6
%
4.0
%
Acquisitions
―
2.0
1.3
Divestitures
(0.1)
―
―
Translation
(1.8)
(1.9)
2.4
Total sales change
1.1
%
3.7
%
7.7
%
Operating income (millions)
$
945
$
943
$
855
Percent change
0.2
%
10.3
%
(0.5)
%
Percent of sales
21.3
%
21.5
%
20.2
%
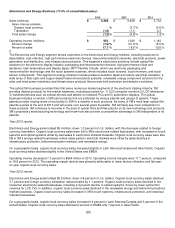
The Consumer segment serves markets that include consumer retail, office retail, home improvement, building
maintenance and other markets. Products in this segment include office supply products, stationery products, construction
and home improvement products (do-it-yourself), home care products, protective material products, certain consumer
retail personal safety products, and consumer health care products.
Year 2013 results:
Sales in Consumer totaled $4.4 billion, up 1.1 percent in U.S. dollars. Organic local-currency sales increased 3.0 percent,
divestitures reduced sales by 0.1 percent, and foreign currency translation reduced sales by 1.8 percent. On an organic
local-currency basis, sales growth was led by consumer health care, home care, and construction and home
improvement. Organic local-currency sales increased slightly in stationary and office supplies, impacted by continued
consolidation trends in the office retail and wholesale market.
On a geographic basis, organic local-currency sales increased 7 percent in Asia Pacific and 3 percent in both Latin
America/Canada and the United States. Organic local-currency sales declined 1 percent in EMEA.
Consumer operating income was $945 million, up 0.2 percent from 2012. Operating income margins were 21.3 percent,
down slightly from 2012.
As discussed in Note 2, in June 2013, 3M completed the sale of the Scientific Anglers and Ross Reels businesses to The
Orvis Company, Inc. based in Manchester, Vermont.
Year 2012 results:
Sales in Consumer totaled $4.4 billion, up 3.7 percent in U.S. dollars. Organic local-currency sales increased 3.6 percent,
acquisitions added 2.0 percent, and foreign currency translation reduced sales by 1.9 percent. Organic local-currency
sales growth was led by the consumer health care and construction and home improvement businesses. Organic local-
currency sales increased slightly in stationery and office supplies, impacted by continued softness in the office wholesale
and retail markets. Acquisition growth was largely due to the October 2011 acquisition of the do-it-yourself and
professional business of GPI Group. GPI is a manufacturer and marketer of home improvement products such as tapes,
hooks, insulation and floor protection products and accessories. The addition of GPI’s products expands 3M’s product
portfolio in core and complementary categories in the construction and home improvement markets.
On a geographic basis, organic local-currency sales increased 10 percent in Latin America/Canada, and 4 percent in both
Asia Pacific and the United States. EMEA organic local-currency sales decreased 2 percent.
Consumer operating income increased 10.3 percent to $943 million. Operating income margins were 21.5 percent,
compared to 20.2 percent in 2011, as all businesses and major geographic areas posted operating income increases.
Consumer benefited from the combination of selling price increases and raw material cost decreases, in addition to cost-
control efforts.