3M 2013 Annual Report Download - page 37
Download and view the complete annual report
Please find page 37 of the 2013 3M annual report below. You can navigate through the pages in the report by either clicking on the pages listed below, or by using the keyword search tool below to find specific information within the annual report.-
 1
1 -
2
-
3
-
4
-
5
-
6
-
7
-
8
-
9
-
10
-
11
-
12
-
13
-
14
-
15
-
16
-
17
-
18
-
19
-
20
-
21
-
22
-
23
-
24
-
25
-
26
-
 27
27 -
 28
28 -
 29
29 -
 30
30 -
 31
31 -
 32
32 -
 33
33 -
 34
34 -
 35
35 -
 36
36 -
 37
37 -
 38
38 -
 39
39 -
 40
40 -
 41
41 -
 42
42 -
 43
43 -
 44
44 -
 45
45 -
 46
46 -
 47
47 -
48
-
49
-
50
-
51
-
52
-
53
-
54
-
55
-
56
-
57
-
58
-
59
-
60
-
61
-
62
-
63
-
64
-
65
-
66
-
67
-
68
-
69
-
70
-
71
-
72
-
73
-
74
-
75
-
76
-
77
-
78
-
79
-
80
-
81
-
82
-
83
-
84
-
85
-
86
-
87
-
88
-
89
-
90
-
91
-
92
-
93
-
94
-
95
-
96
-
97
-
98
-
99
-
100
-
101
-
102
-
103
-
104
-
105
-
106
-
107
-
108
-
109
-
110
-
111
-
112
-
113
-
114
-
115
-
116
-
117
-
118
-
119
-
120
-
121
-
122
-
123
-
124
-
125
-
126
-
127
-
128
-
129
-
130
-
131
-
132
 |
 |

31
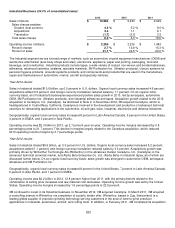
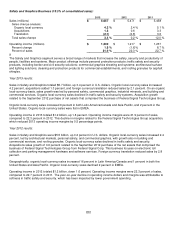
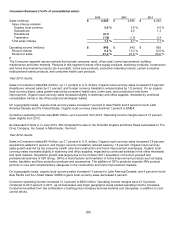
United States at 4.2 percent. Organic local-currency sales increased in Asia Pacific by 0.1 percent and declined in EMEA
by 0.6 percent. For 2012, international operations represented 64.7 percent of 3M’s sales.
Geographic Area Supplemental Information
Employees as of December 31,
Capital Spending
Property, Plant and
Equipment -
net
as of December 31,
(Millions, except Employees)
2013
2012
2011
2013
2012
2011
2013
2012
United States
34,719
34,851
33,246
$
941
$
816
$
688
$
4,478
$
4,279
Asia Pacific
18,417
18,210
18,015
284
332
409
1,943
2,029
Europe, Middle East and Africa
20,504
20,638
20,113
290
226
180
1,636
1,499
Latin America and Canada
15,027
13,978
12,824
150
110
102
595
571
Total Company
88,667
87,677
84,198
$
1,665
$
1,484
$
1,379
$
8,652
$
8,378
Employment:
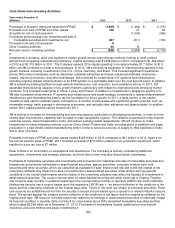
Employment increased by 990 positions in 2013 and 3,479 positions in 2012. Acquisitions increased employment by
approximately 2,500 full-time equivalents for 2012. In addition, the other primary factor that increased employment in both
years was additions in developing economies to support growth.
Capital Spending/Net Property, Plant and Equipment:
Investments in property, plant and equipment enable growth across many diverse markets, helping to meet product
demand and increasing manufacturing efficiency. Capital spending was $1.665 billion in 2013, compared to $1.484 billion
in 2012 and $1.379 billion in 2011. The Company expects 2014 capital spending to be approximately $1.7 billion to $1.8
billion, as 3M continues to invest in its businesses. In 2013, 3M continued its expansion of manufacturing capacity in key
growth markets, including investments in the U.S., China, Germany, and Brazil. This included significant investments
across 3M’s many businesses, such as abrasives, industrial adhesives and tapes, advanced materials, electronics-
related, infection prevention, and other businesses. 3M continued its investments in IT systems and infrastructure,
including ongoing phased implementation of an ERP system on a worldwide basis over the next several years. In addition,
3M is sustaining existing facilities through general maintenance, cost reduction, and compliance efforts. In 2012, 3M
expanded manufacturing capacity in key growth markets, particularly with respect to international and emerging market
countries. This included investments in China, Turkey and Poland, in addition to investments in Singapore and the U.S.
3M also increased investments in IT systems and infrastructure and made strategic investments in research/development
infrastructure and manufacturing sites to lay the foundation for future growth. In 2011, a large portion of the capital
investment was used to address supply constraints in a number of businesses with significant growth potential, such as
renewable energy, traffic signage in developing economies, and optically clear adhesives and glass bubbles. In addition,
certain 2010 capital projects carried forward into 2011.
3M is striving to increase its manufacturing and sourcing capacity in developing economies in order to more closely align
its production capability with its sales in major geographic regions. The initiative is expected to help improve customer
service, lower transportation costs, and reduce working capital requirements. 3M will continue to make investments in
critical emerging markets, such as China, Brazil, Poland and India, including plans to establish and begin production in a
new wholly-owned manufacturing entity in India to serve as a source of supply to 3M's business in India and in other
countries.
CRITICAL ACCOUNTING ESTIMATES
Information regarding significant accounting policies is included in Note 1. As stated in Note 1, the preparation of financial
statements requires management to make estimates and assumptions that affect the reported amounts of assets,
liabilities, revenue and expenses, and related disclosure of contingent assets and liabilities. Management bases its
estimates on historical experience and on various assumptions that are believed to be reasonable under the
circumstances, the results of which form the basis for making judgments about the carrying values of assets and liabilities
that are not readily apparent from other sources. Actual results may differ from these estimates.
The Company believes its most critical accounting estimates relate to legal proceedings, the Company’s pension and
postretirement obligations, asset impairments and income taxes. Senior management has discussed the development,
selection and disclosure of its critical accounting estimates with the Audit Committee of 3M’s Board of Directors.