3M 2007 Annual Report Download - page 75
Download and view the complete annual report
Please find page 75 of the 2007 3M annual report below. You can navigate through the pages in the report by either clicking on the pages listed below, or by using the keyword search tool below to find specific information within the annual report.-
 1
1 -
2
-
3
-
4
-
5
-
6
-
7
-
8
-
9
-
10
-
11
-
12
-
13
-
14
-
15
-
16
-
17
-
18
-
19
-
20
-
21
-
22
-
23
-
24
-
25
-
26
-
27
-
28
-
29
-
30
-
31
-
32
-
33
-
34
-
35
-
36
-
37
-
38
-
39
-
40
-
41
-
42
-
43
-
44
-
45
-
46
-
47
-
48
-
49
-
50
-
51
-
52
-
53
-
54
-
55
-
56
-
57
-
58
-
59
-
60
-
61
-
62
-
63
-
64
-
 65
65 -
 66
66 -
 67
67 -
 68
68 -
 69
69 -
 70
70 -
 71
71 -
 72
72 -
 73
73 -
 74
74 -
 75
75 -
 76
76 -
 77
77 -
 78
78 -
 79
79 -
 80
80 -
 81
81 -
 82
82 -
 83
83 -
 84
84 -
 85
85 -
86
-
87
-
88
-
89
-
90
-
91
-
92
-
93
-
94
-
95
-
96
-
97
-
98
-
99
-
100
 |
 |

69
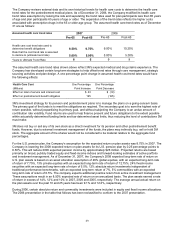
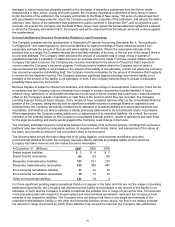
The Company reviews external data and its own historical trends for health care costs to determine the health care
trend rates for the postretirement medical plans. As of December 31, 2006, the Company modified its health care
trend rates assumption by raising the rate and separating the trend rates used for plan participants less than 65 years
of age and plan participants 65 years of age or older. The separation of the trend rates reflects the higher costs
associated with prescription drugs in the 65 or older age group. The assumed health care trend rates as of December
31 are as follows:
Assumed health care trend rates 2007 2006
Pre-65 Post-65 Pre-65 Post-65
Health care cost trend rate used to
determine benefit obligations
8.50%
9.75%
9.00%
10.25%
Rate that the cost trend rate is assumed
to decline to (ultimate trend rate)
5.00%
5.00%
5.00%
5.00%
Years to Ultimate Trend Rate 8 8 9 9
The assumed health care trend rates shown above reflect 3M’s expected medical and drug claims experience. The
Company has developed certain long-term strategies to help offset trend rates through care management, strategic
sourcing activities and plan design. A one percentage point change in assumed health cost trend rates would have
the following effects:
Health Care Cost One Percentage One Percentage
(Millions) Point Increase Point Decrease
Effect on total of service and interest cost $ 23 $ (19)
Effect on postretirement benefit obligation 195 (165)
3M’s investment strategy for its pension and postretirement plans is to manage the plans on a going-concern basis.
The primary goal of the funds is to meet the obligations as required. The secondary goal is to earn the highest rate of
return possible, without jeopardizing its primary goal, and without subjecting the Company to an undue amount of
contribution rate volatility. Fund returns are used to help finance present and future obligations to the extent possible
within actuarially determined funding limits and tax-determined asset limits, thus reducing the level of contributions 3M
must make.
3M does not buy or sell any of its own stock as a direct investment for its pension and other postretirement benefit
funds. However, due to external investment management of the funds, the plans may indirectly buy, sell or hold 3M
stock. The aggregate amount of the shares would not be considered to be material relative to the aggregate fund
percentages.
For the U.S. pension plan, the Company’s assumption for the expected return on plan assets was 8.75% in 2007. The
Company is lowering the 2008 expected return on plan assets for its U.S. pension plan by 0.25 percentage points to
8.50%. This will reduce 2008 expected pension income by approximately $26 million. Projected returns are based
primarily on broad, publicly traded equity and fixed-income indices and forward-looking estimates of active portfolio
and investment management. As of December 31, 2007, the Company's 2008 expected long-term rate of return on
U.S. plan assets is based on an asset allocation assumption of 46% global equities, with an expected long-term rate
of return of 7.75%, 13% private equities with an expected long-term rate of return of 12.75%; 24% fixed-income
securities with an expected long-term rate of return of 5.0%; 12% absolute return investments independent of
traditional performance benchmarks, with an expected long term return of 7%, 5% commodities with an expected
long-term rate of return of 6.5%. The company expects additional positive return from active investment management.
These assumptions result in an 8.50% expected rate of return on an annualized basis. The plan assets earned a rate
of return in excess of 14%, 12% and 10% in 2007, 2006 and 2005, respectively. The average annual actual return on
the plan assets over the past 10 and 25 years has been 9.1% and 12.2%, respectively.
During 2006, certain absolute return and commodity investments were included in equity and fixed income allocations.
The 2006 presentation in the table that follows has been reclassified to conform to the 2007 presentation.