3M 2007 Annual Report Download - page 72
Download and view the complete annual report
Please find page 72 of the 2007 3M annual report below. You can navigate through the pages in the report by either clicking on the pages listed below, or by using the keyword search tool below to find specific information within the annual report.-
 1
1 -
2
-
3
-
4
-
5
-
6
-
7
-
8
-
9
-
10
-
11
-
12
-
13
-
14
-
15
-
16
-
17
-
18
-
19
-
20
-
21
-
22
-
23
-
24
-
25
-
26
-
27
-
28
-
29
-
30
-
31
-
32
-
33
-
34
-
35
-
36
-
37
-
38
-
39
-
40
-
41
-
42
-
43
-
44
-
45
-
46
-
47
-
48
-
49
-
50
-
51
-
52
-
53
-
54
-
55
-
56
-
57
-
58
-
59
-
60
-
61
-
 62
62 -
 63
63 -
 64
64 -
 65
65 -
 66
66 -
 67
67 -
 68
68 -
 69
69 -
 70
70 -
 71
71 -
 72
72 -
 73
73 -
 74
74 -
 75
75 -
 76
76 -
 77
77 -
 78
78 -
 79
79 -
 80
80 -
 81
81 -
 82
82 -
83
-
84
-
85
-
86
-
87
-
88
-
89
-
90
-
91
-
92
-
93
-
94
-
95
-
96
-
97
-
98
-
99
-
100
 |
 |

66
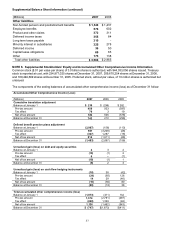
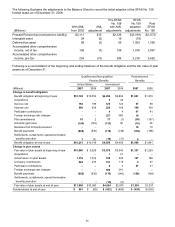
The following illustrates the adjustments to the Balance Sheet to record the initial adoption of the SFAS No. 158
funded status as of December 31, 2006:
Pre-SFAS
No. 158
SFAS
No.158
Post
With AML AML with AML adoption SFAS
(Millions) from 2005 adjustment adjustments adjustments No. 158
Prepaid Pension/(accrued pension liability) $2,111 $15 $2,126 $(3,199) $(1,073)
Intangible asset 24 (5) 19 (19) –
Deferred tax asset 98 (3) 95 1,300 1,395
Accumulated other comprehensive
income, net of tax 156 (7) 149 1,918 2,067
Accumulated other comprehensive
income, pre-tax 254 (10) 244 3,218 3,462
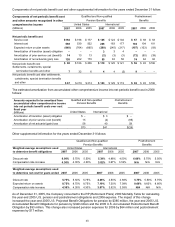
Following is a reconciliation of the beginning and ending balances of the benefit obligation and the fair value of plan
assets as of December 31:
Qualified and Non-qualified Postretirement
Pension Benefits Benefits
United States International
(Millions) 2007 2006 2007 2006
2007 2006
Change in benefit obligation
Benefit obligation at beginning of year $10,149 $10,052 $4,450 $3,884 $1,841 $1,918
Acquisitions – – 322 – –
Service cost 192 196 125 124 57 58
Interest cost 568 539 228 183 104 104
Participant contributions – – 44 47 41
Foreign exchange rate changes – – 337 365 14 –
Plan amendments 18 2 17 (1) (98) (157)
Actuarial (gain) loss (154) (142) (114) 26 (16) 35
Medicare Part D Reimbursement – – – – 10 10
Benefit payments (565) (530) (175) (146) (159) (168)
Settlements, curtailments, special termination
benefits and other 7 32 (19) (11) 9 –
Benefit obligation at end of year $10,215 $10,149 $4,856 $4,450 $1,809 $1,841
Change in plan assets
Fair value of plan assets at beginning of year $10,060 $ 9,285 $3,970 $3,340 $1,337 $1,239
Acquisitions – –1 21 – –
Actual return on plan assets 1,376 1,072 188 325 127 188
Company contributions 225 233 151 115 3 37
Participant contributions – –44 47 41
Foreign exchange rate changes – –300 316 – –
Benefit payments (565) (530) (175) (146) (159) (168)
Settlements, curtailments, special termination
benefits and other – – (15) (5) – –
Fair value of plan assets at end of year $11,096 $10,060 $4,424 $3,970 $1,355 $1,337
Funded status at end of year $ 881 $ (89) $ (432) $ (480) $ (454) $ (504)