3M 2007 Annual Report Download - page 62
Download and view the complete annual report
Please find page 62 of the 2007 3M annual report below. You can navigate through the pages in the report by either clicking on the pages listed below, or by using the keyword search tool below to find specific information within the annual report.-
 1
1 -
2
-
3
-
4
-
5
-
6
-
7
-
8
-
9
-
10
-
11
-
12
-
13
-
14
-
15
-
16
-
17
-
18
-
19
-
20
-
21
-
22
-
23
-
24
-
25
-
26
-
27
-
28
-
29
-
30
-
31
-
32
-
33
-
34
-
35
-
36
-
37
-
38
-
39
-
40
-
41
-
42
-
43
-
44
-
45
-
46
-
47
-
48
-
49
-
50
-
51
-
 52
52 -
 53
53 -
 54
54 -
 55
55 -
 56
56 -
 57
57 -
 58
58 -
 59
59 -
 60
60 -
 61
61 -
 62
62 -
 63
63 -
 64
64 -
 65
65 -
 66
66 -
 67
67 -
 68
68 -
 69
69 -
 70
70 -
 71
71 -
 72
72 -
73
-
74
-
75
-
76
-
77
-
78
-
79
-
80
-
81
-
82
-
83
-
84
-
85
-
86
-
87
-
88
-
89
-
90
-
91
-
92
-
93
-
94
-
95
-
96
-
97
-
98
-
99
-
100
 |
 |

56
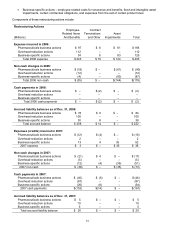
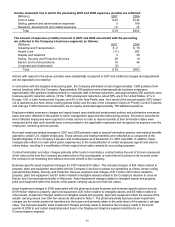
Other Exit Activities:
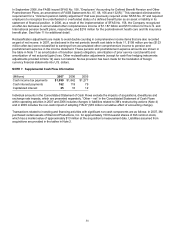
During the second half of 2007, the Company recorded net pre-tax charges of $45 million related to exit activities. These
charges related to employee reductions and fixed asset impairments, including the consolidation of certain flexible circuit
manufacturing operations ($23 million recorded in the Electro and Communications segment) and other actions, primarily
in the Display and Graphics segment and Industrial and Transportation segment. These charges were recorded in cost of
sales and selling, general and administrative expenses and research, development and related expenses.
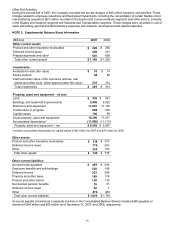
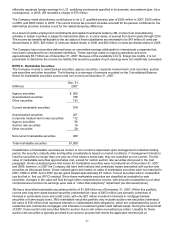
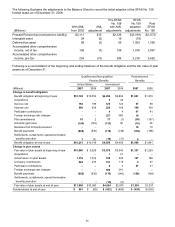
NOTE 5. Supplemental Balance Sheet Information
(Millions) 2007 2006
Other current assets
Product and other insurance receivables $ 220 $ 255
Deferred income taxes 428 412
Prepaid expenses and other 501 658
Total other current assets $ 1,149 $ 1,325
Investments
Available-for-sale (fair value) $ 16 $ 14
Equity-method 64 86
Cash surrender value of life insurance policies, real
estate and other (cost, which approximates fair value) 218 214
Total investments $ 298 $ 314
Property, plant and equipment – at cost
Land $ 303 $ 281
Buildings and leasehold improvements 5,496 5,002
Machinery and equipment 11,801 11,130
Construction in progress 684 505
Capital leases 106 99
Gross property, plant and equipment 18,390 17,017
Accumulated depreciation* (11,808) (11,110)
Property, plant and equipment – net $ 6,582 $ 5,907
*Includes accumulated depreciation for capital leases of $42 million for 2007 and $37 million for 2006.
Other assets
Product and other insurance receivables $ 318 $ 373
Deferred income taxes 176 253
Other 234 150
Total other assets $ 728 $ 776
Other current liabilities
Accrued trade payables $ 458 $ 556
Employee benefits and withholdings 228 168
Deferred income 323 299
Property and other taxes 169 176
Product and other claims 120 115
Non-funded pension benefits 35 31
Deferred income taxes 22 7
Other 478 409
Total other current liabilities $ 1,833 $ 1,761
Accounts payable (included as a separate line item in the Consolidated Balance Sheet) includes drafts payable on
demand of $44 million and $65 million as of December 31, 2007, and 2006, respectively.