3M 2007 Annual Report Download - page 74
Download and view the complete annual report
Please find page 74 of the 2007 3M annual report below. You can navigate through the pages in the report by either clicking on the pages listed below, or by using the keyword search tool below to find specific information within the annual report.-
 1
1 -
2
-
3
-
4
-
5
-
6
-
7
-
8
-
9
-
10
-
11
-
12
-
13
-
14
-
15
-
16
-
17
-
18
-
19
-
20
-
21
-
22
-
23
-
24
-
25
-
26
-
27
-
28
-
29
-
30
-
31
-
32
-
33
-
34
-
35
-
36
-
37
-
38
-
39
-
40
-
41
-
42
-
43
-
44
-
45
-
46
-
47
-
48
-
49
-
50
-
51
-
52
-
53
-
54
-
55
-
56
-
57
-
58
-
59
-
60
-
61
-
62
-
63
-
 64
64 -
 65
65 -
 66
66 -
 67
67 -
 68
68 -
 69
69 -
 70
70 -
 71
71 -
 72
72 -
 73
73 -
 74
74 -
 75
75 -
 76
76 -
 77
77 -
 78
78 -
 79
79 -
 80
80 -
 81
81 -
 82
82 -
 83
83 -
 84
84 -
85
-
86
-
87
-
88
-
89
-
90
-
91
-
92
-
93
-
94
-
95
-
96
-
97
-
98
-
99
-
100
 |
 |

68
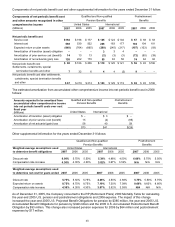
Components of net periodic benefit cost and other supplemental information for the years ended December 31 follow:
Components of net periodic benefit cost Qualified and Non-qualified Postretirement
and other amounts recognized in other Pension Benefits Benefits
comprehensive income United States International
(Millions) 2007 2006 2005 2007 2006 2005 2007 2006 2005
Net periodic benefit cost
Service cost $192 $ 196 $ 177 $ 125 $ 124 $ 102 $ 57 $ 58 $ 53
Interest cost 568 539 502 228 183 177
104 104 101
Expected return on plan assets (840) (764) (665) (290) (245) (217) (107) (103) (93)
Amortization of transition (asset) obligation – – –33 4 – – –
Amortization of prior service cost (benefit) 14 13 13
(2) (3) (3) (72) (50) (39)
Amortization of net actuarial (gain) loss 126 202 179 55 63 58 74 84 84
Net periodic benefit cost $ 60 $ 186 $ 206 $ 119 $ 125 $ 121
$ 56 $ 93 $106
Settlements, curtailments, special
termination benefits and other 7 32 6
4 4 (2) 9 – –
Net periodic benefit cost after settlements,
curtailments, special termination benefits
and other $ 67 $ 218 $ 212 $ 123 $ 129 $ 119 $ 65 $ 93 $106
The estimated amortization from accumulated other comprehensive income into net periodic benefit cost in 2008
follows:
Qualified and Non-qualified
Pension Benefits
Postretirement
Benefits
Amounts expected to be amortized from
accumulated other comprehensive income
into net periodic benefit costs over next
fiscal year
(Millions)
United States
International
Amortization of transition (asset) obligation $ – $ 3 $ –
Amortization of prior service cost (benefit) 15 (2) (85)
Amortization of net actuarial (gain) loss 58 40 59
$73 $41 $(26)
Other supplemental information for the years ended December 31 follows:
Qualified and Non-qualified Postretirement
Pension Benefits Benefits
Weighted-average assumptions used United States International
to determine benefit obligations 2007 2006 2005 2007 2006 2005 2007 2006 2005
Discount rate 6.00% 5.75% 5.50% 5.39% 4.88% 4.50% 6.00% 5.75% 5.50%
Compensation rate increase 4.30% 4.30% 4.30% 3.82% 3.67% 3.52% N/A N/A N/A
Weighted-average assumptions used
to determine net cost for years ended 2007 2006 2005 2007 2006 2005
2007 2006 2005
Discount rate 5.75% 5.50% 5.75% 4.88% 4.50% 4.88% 5.75% 5.50% 5.75%
Expected return on assets 8.75% 8.75% 8.75% 7.19% 7.20% 7.08% 8.60% 8.60% 8.60%
Compensation rate increase 4.30% 4.30% 4.30% 3.67% 3.52% 3.55% N/A N/A N/A
As of December 31, 2005, the Company converted to the RP (Retirement Plans) 2000 Mortality Table for calculating
the year-end 2005 U.S. pension and postretirement obligations and 2006 expense. The impact of this change
increased the year-end 2005 U.S. Projected Benefit Obligations for pension by $385 million, the year-end 2005 U.S.
Accumulated Benefit Obligations for pension by $349 million and the 2005 U.S. Accumulated Postretirement Benefit
Obligation by $93 million. This change also increased pension expenses for 2006 by $64 million and postretirement
expenses by $17 million.