Yamaha 2012 Annual Report Download - page 13
Download and view the complete annual report
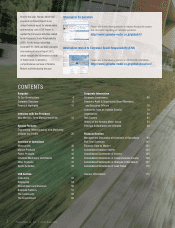
Please find page 13 of the 2012 Yamaha annual report below. You can navigate through the pages in the report by either clicking on the pages listed below, or by using the keyword search tool below to find specific information within the annual report.-
 1
1 -
2
-
 3
3 -
 4
4 -
 5
5 -
 6
6 -
 7
7 -
 8
8 -
 9
9 -
 10
10 -
 11
11 -
 12
12 -
 13
13 -
 14
14 -
 15
15 -
 16
16 -
 17
17 -
 18
18 -
 19
19 -
 20
20 -
 21
21 -
 22
22 -
 23
23 -
24
-
25
-
26
-
27
-
28
-
29
-
30
-
31
-
32
-
33
-
34
-
35
-
36
-
37
-
38
-
39
-
40
-
41
-
42
-
43
-
44
-
45
-
46
-
47
-
48
-
49
-
50
-
51
-
52
-
53
-
54
-
55
-
56
-
57
-
58
-
59
-
60
-
61
-
62
-
63
-
64
-
65
-
66
-
67
-
68
-
69
-
70
-
71
-
72
-
73
-
74
-
75
-
76
-
77
-
78
-
79
-
80
-
81
-
82
-
83
-
84
-
85
-
86
-
87
-
88
-
89
-
90
-
91
-
92
-
93
-
94
-
95
-
96
-
97
-
98
-
99
-
100
-
101
-
102
-
103
-
104
-
105
-
106
-
107
-
108
-
109
-
110
-
111
-
112
-
113
-
114
 |
 |

Cash dividends per share
(¥)
Market capitalization
(Billion ¥)
28
21
14
7
0
25.50
15.50
10.00
00
600
450
300
150
0
333
462
340
267
(Persons)
Number of employees
60,000
45,000
30,000
15,000
0
49,761 49,994 52,184 54,677 53,958
331
2008 2009 2010 2011 2012 2008 2009 2010 2011 2012 2008 2009 2010 2011 2012
962
Total assets and return on assets
(Billion ¥) (%) (%)
Net assets and equity ratio
(Billion ¥)
Net income per share
(¥)
1,200
900
600
300
0
9
6
3
0
-25
1,163
987 978
900
0.2
1.9 2.9
0.8
-20.1
480
360
240
120
0
40
30
20
10
0
311 310
33.9
21.5
28.0
31.2
342
32.0
428
90
60
30
0
-800 -756
6
56
21
77
249
2008 2009 2010 2011 2012 2008 2009 2010 2011 2012 2008 2009 2010 2011 2012
Net assets Equity ratio (%)Total assets Return on assets (%)
Net income and net income margin
(Billion ¥) (%)
Net income Net income margin (%)
Operating income and operating income margin
(Billion ¥) (%)
Operating income Operating income margin (%)
Net sales
(Billion ¥)
30
20
10
0
-250
6.0
4.0
2.0
0
-20.0
18.3
7.5
27.0
1.9 0.1
1.4
2.1
0.6
-18.7
-216.1
60
40
20
0
-80
9
6
3
0
-10
-62.6
3.0
4.0
-5.4
51.3
4.2
1.5
53.4
18.6
1,604
1,154
1,294 1,276 1,208
2,000
1,500
1,000
500
0
2008 2009 2010 2011 2012 2008 2009 2010 2011 2012 2008 2009 2010 2011 2012
48.4
Yamaha Motor Co., Ltd. Annual Report 2012 11
Snapshot
Interview with the
President
Special Features
Overview of
Operations
CSR Section
Corporate
Information
Financial Section