Yamaha 2012 Annual Report Download - page 12
Download and view the complete annual report
Please find page 12 of the 2012 Yamaha annual report below. You can navigate through the pages in the report by either clicking on the pages listed below, or by using the keyword search tool below to find specific information within the annual report.-
 1
1 -
 2
2 -
 3
3 -
 4
4 -
 5
5 -
 6
6 -
 7
7 -
 8
8 -
 9
9 -
 10
10 -
 11
11 -
 12
12 -
 13
13 -
 14
14 -
 15
15 -
 16
16 -
 17
17 -
 18
18 -
 19
19 -
 20
20 -
 21
21 -
 22
22 -
23
-
24
-
25
-
26
-
27
-
28
-
29
-
30
-
31
-
32
-
33
-
34
-
35
-
36
-
37
-
38
-
39
-
40
-
41
-
42
-
43
-
44
-
45
-
46
-
47
-
48
-
49
-
50
-
51
-
52
-
53
-
54
-
55
-
56
-
57
-
58
-
59
-
60
-
61
-
62
-
63
-
64
-
65
-
66
-
67
-
68
-
69
-
70
-
71
-
72
-
73
-
74
-
75
-
76
-
77
-
78
-
79
-
80
-
81
-
82
-
83
-
84
-
85
-
86
-
87
-
88
-
89
-
90
-
91
-
92
-
93
-
94
-
95
-
96
-
97
-
98
-
99
-
100
-
101
-
102
-
103
-
104
-
105
-
106
-
107
-
108
-
109
-
110
-
111
-
112
-
113
-
114
 |
 |

Millions of yen % change
2008 2009 2010 2011 2012 2012/2011
For the year:
Net sales ¥1,603,881 ¥1,153,642 ¥ 1,294,131 ¥ 1,276,159 ¥ 1,207,675 (5.4)%
Gross profi t 377,105 202,292 295,565 276,046 235,068 (14.8)
Operating income (loss) 48,382 (62,580) 51,308 53,405 18,598 (65.2)
Ordinary income (loss) 58,872 (68,340) 66,142 63,495 27,267 (57.1)
Net income (loss) 1,851 (216,148) 18,300 26,960 7,489 (72.2)
Net cash provided by (used in) operating activities
(6,446) 74,096 104,531 33,328 (2,385) —
Net cash provided by (used in) investing activities
(99,543) (45,285) (37,632) (46,517) (51,081) 9.8
Free cash fl ows (105,989) 28,810 66,899 (13,189) (53,466) —
Net cash provided by (used in) fi nancing activities
163,179 (32,022) 5,296 (51,927) 15,761 —
Capital expenditures 94,391 46,035 33,939 45,049 48,788 8.3
Depreciation expenses 59,606 53,701 36,594 33,578 34,278 2.1
At the year end:
Total assets ¥1,163,173 ¥ 987,077 ¥ 978,343 ¥ 900,420 ¥ 962,329 6.9%
Net assets 428,483 249,266 310,809 309,914 341,561 10.2
Interest-bearing debt 349,203 399,942 322,443 274,721 326,976 19.0
Ratios:
Operating income margin (%) 3.0 (5.4) 4.0 4.2 1.5
Return on equity (%) 0.4 (71.2) 7.5 9.7 2.5
Equity ratio (%) 33.9 21.5 28.0 31.2 32.0
Price/earnings ratio (times) 144.0 — 23.8 12.6 44.2
Debt/equity ratio (%) 88.5 188.3 117.6 97.8 106.2
Yen % change
Per share amounts:
Net income — basic ¥ 6.47 ¥ (755.92) ¥ 55.50 ¥ 77.23 ¥ 21.45 (72.2)%
Net income — diluted 6.47 — 55.50 77.23 ——
Net assets 1,377.81 743.04 785.61 804.26 881.88 9.7
Cash dividends 25.50 0.00 0.00 15.50 10.00 (35.5)
Millions of yen, except per share data % change
Share performance (at the year end):
Price per share (yen)
¥ 932 ¥ 1,166 ¥ 1,323 ¥ 974 ¥ 949 (2.6)%
Market capitalization 266,899 333,300 461,855 340,018 331,288 (2.6)
Persons % change
Other data (at the year end):
Number of shareholders 35,156 30,013 31,615 32,259 32,873 1.9%
Number of employees 49,761 49,994 52,184 54,677 53,958 (1.3)
Notes • References to fi scal years are to 12-month periods commencing on January 1 and ending on December 31.
• With regard to amounts stated in million yen units, amounts less than ¥1 million are truncated. For amounts stated in 0.1 billion or billion yen units, amounts less than ¥0.1 billion or ¥1 billion,
respectively, are rounded off.
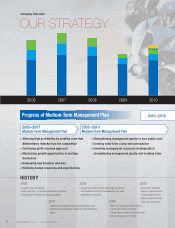
In addition to the impact of the strong yen, slower motorcycle sales in Europe and emerging markets resulted in a
5.4% decline in net sales.
While positive factors such as cost reductions, decreased raw material costs, and expense reductions were in
evidence, a decrease in sales of motorcycles in Europe and in emerging nations, the appreciating yen, the reversal
of provision for product liabilities (¥13.4 billion in the previous year and ¥2.4 billion in this fiscal year), and increased
development expenses aimed at future growth, all contributed to a decrease in profits. As a result, 2012 operating
income decreased 65.2% and net income decreased 72.2% from 2011.
POINT
Financial Highlights
Yamaha Motor Co., Ltd. and Consolidated Subsidiaries
Years ended December 31
Yamaha Motor Co., Ltd. Annual Report 2012
10
Snapshot
Interview with the
President
Special Features
Overview of
Operations
CSR Section
Corporate
Information
Financial Section