Xcel Energy 2013 Annual Report Download - page 69
Download and view the complete annual report
Please find page 69 of the 2013 Xcel Energy annual report below. You can navigate through the pages in the report by either clicking on the pages listed below, or by using the keyword search tool below to find specific information within the annual report.
51
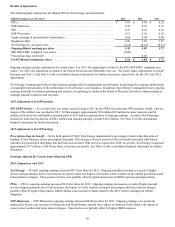
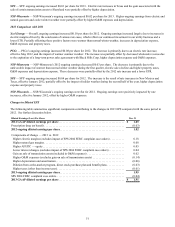
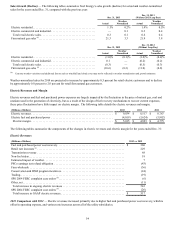
SPS — SPS’ ongoing earnings increased $0.01 per share for 2013. Electric rate increases in Texas and the gain associated with the
sale of certain transmission assets to Sharyland were partially offset by higher depreciation.
NSP-Wisconsin — NSP-Wisconsin’s ongoing earnings increased $0.02 per share for 2013. Higher ongoing earnings from electric and
natural gas rates and cooler winter weather were partially offset by higher O&M expenses and depreciation.
2012 Comparison with 2011
Xcel Energy — Overall, ongoing earnings increased $0.10 per share for 2012. Ongoing earnings increased largely due to increases in
electric margins driven by the conclusion of various rate cases, which reflect our continued investment in our utility business and a
lower ETR. Partially offsetting these positive factors were warmer than normal winter weather, increases in depreciation expense,
O&M expenses and property taxes.
PSCo — PSCo’s ongoing earnings increased $0.08 per share for 2012. The increase is primarily due to an electric rate increase,
effective May 2012, and the impact of warmer summer weather. The increase was partially offset by decreased wholesale revenue due
to the expiration of a long-term power sales agreement with Black Hills Corp, higher depreciation expense and O&M expenses.
NSP-Minnesota — NSP-Minnesota’s 2012 ongoing earnings decreased $0.03 per share. The decrease is primarily due to the
unfavorable impact of warmer than normal winter weather during the first quarter, electric sales decline and higher property taxes,
O&M expenses and depreciation expense. These decreases were partially offset by the 2012 rate increase and a lower ETR.
SPS — SPS’ ongoing earnings increased $0.04 per share for 2012. The increase is the result of rate increases in New Mexico and
Texas, effective January 2012, partially offset by the impact of milder weather during the second half of the year, higher depreciation
expense and property taxes.
NSP-Wisconsin — NSP-Wisconsin’s ongoing earnings were flat for 2012. Ongoing earnings were positively impacted by rate
increases, effective January 2012, offset by higher O&M expenses.
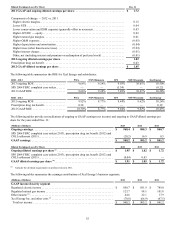
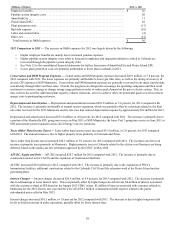
Changes in Diluted EPS
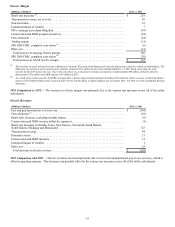
The following table summarizes significant components contributing to the changes in 2013 EPS compared with the same period in
2012. See further discussion below.
Diluted Earnings (Loss) Per Share Dec. 31
2012 GAAP diluted earnings per share. . . . . . . . . . . . . . . . . . . . . . . . . . . . . . . . . . . . . . . . . . . . . . $ 1.85
Prescription drug tax benefit . . . . . . . . . . . . . . . . . . . . . . . . . . . . . . . . . . . . . . . . . . . . . . . . . . . . . . . . (0.03)
2012 ongoing diluted earnings per share. . . . . . . . . . . . . . . . . . . . . . . . . . . . . . . . . . . . . . . . . . . . . 1.82
Components of change — 2013 vs. 2012
Higher electric margins (excludes impact of SPS 2004 FERC complaint case orders) . . . . . . . . . . 0.18
Higher natural gas margins . . . . . . . . . . . . . . . . . . . . . . . . . . . . . . . . . . . . . . . . . . . . . . . . . . . . . . . . 0.08
Higher AFUDC — equity. . . . . . . . . . . . . . . . . . . . . . . . . . . . . . . . . . . . . . . . . . . . . . . . . . . . . . . . . 0.05
Lower interest charges (excludes impact of SPS 2004 FERC complaint case orders). . . . . . . . . . . 0.04
Gain on sale of transmission assets (included in O&M expenses) . . . . . . . . . . . . . . . . . . . . . . . . . . 0.02
Higher O&M expenses (excludes gain on sale of transmission assets) . . . . . . . . . . . . . . . . . . . . . . (0.14)
Higher depreciation and amortization. . . . . . . . . . . . . . . . . . . . . . . . . . . . . . . . . . . . . . . . . . . . . . . . (0.06)
Dilution from at-the-market program, direct stock purchase plan and benefit plans . . . . . . . . . . . . (0.03)
Higher taxes (other than income taxes). . . . . . . . . . . . . . . . . . . . . . . . . . . . . . . . . . . . . . . . . . . . . . . (0.01)
2013 ongoing diluted earnings per share. . . . . . . . . . . . . . . . . . . . . . . . . . . . . . . . . . . . . . . . . . . . . 1.95
SPS 2004 FERC complaint case orders. . . . . . . . . . . . . . . . . . . . . . . . . . . . . . . . . . . . . . . . . . . . . . . . (0.04)
2013 GAAP diluted earnings per share. . . . . . . . . . . . . . . . . . . . . . . . . . . . . . . . . . . . . . . . . . . . . . $ 1.91


