Xcel Energy 2013 Annual Report Download - page 131
Download and view the complete annual report
Please find page 131 of the 2013 Xcel Energy annual report below. You can navigate through the pages in the report by either clicking on the pages listed below, or by using the keyword search tool below to find specific information within the annual report.-
 1
1 -
2
-
3
-
4
-
5
-
6
-
7
-
8
-
9
-
10
-
11
-
12
-
13
-
14
-
15
-
16
-
17
-
18
-
19
-
20
-
21
-
22
-
23
-
24
-
25
-
26
-
27
-
28
-
29
-
30
-
31
-
32
-
33
-
34
-
35
-
36
-
37
-
38
-
39
-
40
-
41
-
42
-
43
-
44
-
45
-
46
-
47
-
48
-
49
-
50
-
51
-
52
-
53
-
54
-
55
-
56
-
57
-
58
-
59
-
60
-
61
-
62
-
63
-
64
-
65
-
66
-
67
-
68
-
69
-
70
-
71
-
72
-
73
-
74
-
75
-
76
-
77
-
78
-
79
-
80
-
81
-
82
-
83
-
84
-
85
-
86
-
87
-
88
-
89
-
90
-
91
-
92
-
93
-
94
-
95
-
96
-
97
-
98
-
99
-
100
-
101
-
102
-
103
-
104
-
105
-
106
-
107
-
108
-
109
-
110
-
111
-
112
-
113
-
114
-
115
-
116
-
117
-
118
-
119
-
120
-
 121
121 -
 122
122 -
 123
123 -
 124
124 -
 125
125 -
 126
126 -
 127
127 -
 128
128 -
 129
129 -
 130
130 -
 131
131 -
 132
132 -
 133
133 -
 134
134 -
 135
135 -
 136
136 -
 137
137 -
 138
138 -
 139
139 -
 140
140 -
 141
141 -
142
-
143
-
144
-
145
-
146
-
147
-
148
-
149
-
150
-
151
-
152
-
153
-
154
-
155
-
156
-
157
-
158
-
159
-
160
-
161
-
162
-
163
-
164
-
165
-
166
-
167
-
168
-
169
-
170
-
171
-
172
-
173
-
174
-
175
-
176
-
177
-
178
-
179
-
180
 |
 |

113
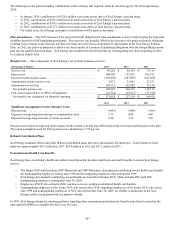
If forecasted costs of electric transmission congestion increase or decrease for a given FTR path, the value of that particular FTR
instrument will likewise increase or decrease. Given the limited observability of management’s forecasts for several of the inputs to
this complex valuation model – including expected plant operating schedules and retail and wholesale demand, fair value
measurements for FTRs have been assigned a Level 3. Non-trading monthly FTR settlements are included in the FCA as applicable in
each jurisdiction, and therefore changes in the fair value of the yet to be settled portions of most FTRs are deferred as a regulatory
asset or liability. Given this regulatory treatment and the limited magnitude of FTRs relative to the electric utility operations of NSP-
Minnesota and SPS, the numerous unobservable quantitative inputs to the complex model used for valuation of FTRs are insignificant
to the consolidated financial statements of Xcel Energy.
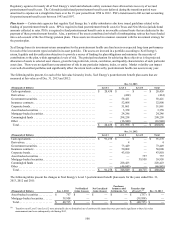
Non-Derivative Instruments Fair Value Measurements
The NRC requires NSP-Minnesota to maintain a portfolio of investments to fund the costs of decommissioning its nuclear generating
plants. Together with all accumulated earnings or losses, the assets of the nuclear decommissioning fund are legally restricted for the
purpose of decommissioning the Monticello and Prairie Island nuclear generating plants. The fund contains cash equivalents, debt
securities, equity securities and other investments – all classified as available-for-sale. NSP-Minnesota plans to reinvest matured
securities until decommissioning begins. NSP-Minnesota uses the MPUC approved asset allocation for the escrow and investment
targets by asset class for both the escrow and qualified trust.
NSP-Minnesota recognizes the costs of funding the decommissioning of its nuclear generating plants over the lives of the plants,
assuming rate recovery of all costs. Given the purpose and legal restrictions on the use of nuclear decommissioning fund assets,
realized and unrealized gains on fund investments over the life of the fund are deferred as an offset of NSP-Minnesota’s regulatory
asset for nuclear decommissioning costs. Consequently, any realized and unrealized gains and losses on securities in the nuclear
decommissioning fund, including any other-than-temporary impairments, are deferred as a component of the regulatory asset for
nuclear decommissioning.
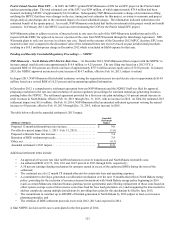
Unrealized gains for the nuclear decommissioning fund were $240.3 million and $135.8 million at Dec. 31, 2013 and 2012,
respectively, and unrealized losses and amounts recorded as other-than-temporary impairments were $58.5 million and $46.4 million
at Dec. 31, 2013 and 2012, respectively.
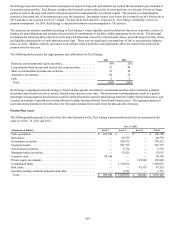
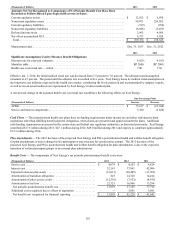
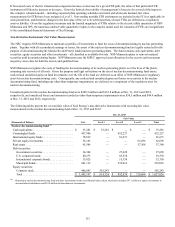
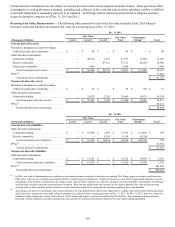
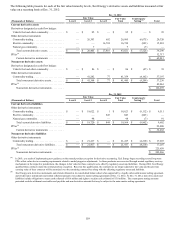
The following tables present the cost and fair value of Xcel Energy’s non-derivative instruments with recurring fair value
measurements in the nuclear decommissioning fund at Dec. 31, 2013 and 2012:
Dec. 31, 2013
Fair Value
(Thousands of Dollars) Cost Level 1 Level 2 Level 3 Total
Nuclear decommissioning fund (a)
Cash equivalents . . . . . . . . . . . . . . . . . . . . . . . . . . . . $ 33,281 $ 33,281 $ — $ — $ 33,281
Commingled funds . . . . . . . . . . . . . . . . . . . . . . . . . . 457,986 — 452,227 — 452,227
International equity funds . . . . . . . . . . . . . . . . . . . . . 78,812 — 81,671 — 81,671
Private equity investments . . . . . . . . . . . . . . . . . . . . 52,143 — — 62,696 62,696
Real estate . . . . . . . . . . . . . . . . . . . . . . . . . . . . . . . . . 45,564 — — 57,368 57,368
Debt securities:
Government securities . . . . . . . . . . . . . . . . . . . . . 34,304 — 27,628 — 27,628
U.S. corporate bonds . . . . . . . . . . . . . . . . . . . . . . 80,275 — 83,538 — 83,538
International corporate bonds. . . . . . . . . . . . . . . . 15,025 — 15,358 — 15,358
Municipal bonds. . . . . . . . . . . . . . . . . . . . . . . . . . 241,112 — 232,016 — 232,016
Equity securities:
Common stock . . . . . . . . . . . . . . . . . . . . . . . . . . . 406,695 581,243 — — 581,243
Total . . . . . . . . . . . . . . . . . . . . . . . . . . . . . . . . . . . $ 1,445,197 $ 614,524 $ 892,438 $ 120,064 $ 1,627,026
(a) Reported in nuclear decommissioning fund and other investments on the consolidated balance sheet, which also includes $87.1 million of equity investments in
unconsolidated subsidiaries and $41.9 million of miscellaneous investments.