Xcel Energy 2013 Annual Report Download - page 135
Download and view the complete annual report
Please find page 135 of the 2013 Xcel Energy annual report below. You can navigate through the pages in the report by either clicking on the pages listed below, or by using the keyword search tool below to find specific information within the annual report.-
 1
1 -
2
-
3
-
4
-
5
-
6
-
7
-
8
-
9
-
10
-
11
-
12
-
13
-
14
-
15
-
16
-
17
-
18
-
19
-
20
-
21
-
22
-
23
-
24
-
25
-
26
-
27
-
28
-
29
-
30
-
31
-
32
-
33
-
34
-
35
-
36
-
37
-
38
-
39
-
40
-
41
-
42
-
43
-
44
-
45
-
46
-
47
-
48
-
49
-
50
-
51
-
52
-
53
-
54
-
55
-
56
-
57
-
58
-
59
-
60
-
61
-
62
-
63
-
64
-
65
-
66
-
67
-
68
-
69
-
70
-
71
-
72
-
73
-
74
-
75
-
76
-
77
-
78
-
79
-
80
-
81
-
82
-
83
-
84
-
85
-
86
-
87
-
88
-
89
-
90
-
91
-
92
-
93
-
94
-
95
-
96
-
97
-
98
-
99
-
100
-
101
-
102
-
103
-
104
-
105
-
106
-
107
-
108
-
109
-
110
-
111
-
112
-
113
-
114
-
115
-
116
-
117
-
118
-
119
-
120
-
121
-
122
-
123
-
124
-
 125
125 -
 126
126 -
 127
127 -
 128
128 -
 129
129 -
 130
130 -
 131
131 -
 132
132 -
 133
133 -
 134
134 -
 135
135 -
 136
136 -
 137
137 -
 138
138 -
 139
139 -
 140
140 -
 141
141 -
 142
142 -
 143
143 -
 144
144 -
 145
145 -
146
-
147
-
148
-
149
-
150
-
151
-
152
-
153
-
154
-
155
-
156
-
157
-
158
-
159
-
160
-
161
-
162
-
163
-
164
-
165
-
166
-
167
-
168
-
169
-
170
-
171
-
172
-
173
-
174
-
175
-
176
-
177
-
178
-
179
-
180
 |
 |

117
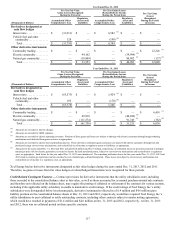
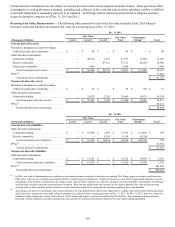
Year Ended Dec. 31, 2012
Pre-Tax Fair Value
Gains (Losses) Recognized
During the Period in:
Pre-Tax (Gains) Losses
Reclassified into Income
During the Period from: Pre-Tax Gains
(Losses)
Recognized
During the Period
in Income(Thousands of Dollars) Accumulated Other
Comprehensive Loss
Regulatory
(Assets) and
Liabilities Accumulated Other
Comprehensive Loss
Regulatory
Assets and
(Liabilities)
Derivatives designated as
cash flow hedges
Interest rate . . . . . . . . . . . . . . . $ (31,913) $ — $ 6,582 (a) $ — $ —
Vehicle fuel and other
commodity. . . . . . . . . . . . . . 120 — (198)(b) — —
Total . . . . . . . . . . . . . . . . . . $ (31,793) $ — $ 6,384 $ — $ —
Other derivative instruments
Commodity trading . . . . . . . . . $ — $ — $ — $ — $ 12,226 (c)
Electric commodity. . . . . . . . . — 44,162 — (39,999)(d) —
Natural gas commodity. . . . . . — (10,809) — 80,902 (e) (137) (d)
Total . . . . . . . . . . . . . . . . . . $ — $ 33,353 $ — $ 40,903 $ 12,089
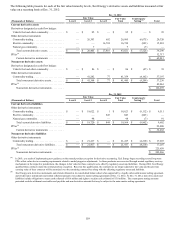
Year Ended Dec. 31, 2011
Pre-Tax Fair Value
Gains (Losses) Recognized
During the Period in:
Pre-Tax (Gains) Losses
Reclassified into Income
During the Period from: Pre-Tax Gains
(Losses)
Recognized
During the Period
in Income(Thousands of Dollars) Accumulated Other
Comprehensive Loss
Regulatory
(Assets) and
Liabilities Accumulated Other
Comprehensive Loss
Regulatory
Assets and
(Liabilities)
Derivatives designated as
cash flow hedges
Interest rate . . . . . . . . . . . . . . . $ (63,573) $ — $ 1,424 (a) $ — $ —
Vehicle fuel and other
commodity. . . . . . . . . . . . . . 195 — (178)(b) — —
Total . . . . . . . . . . . . . . . . . . $ (63,378) $ — $ 1,246 $ — $ —
Other derivative instruments
Commodity trading . . . . . . . . . $ — $ — $ — $ — $ 6,418 (c)
Electric commodity. . . . . . . . . — 49,818 — (40,492)(d) —
Natural gas commodity. . . . . . — (111,574) — 91,743 (e) (382) (d)
Total . . . . . . . . . . . . . . . . . . $ — $ (61,756) $ — $ 51,251 $ 6,036
(a) Amounts are recorded to interest charges.
(b) Amounts are recorded to O&M expenses.
(c) Amounts are recorded to electric operating revenues. Portions of these gains and losses are subject to sharing with electric customers through margin-sharing
mechanisms and deducted from gross revenue, as appropriate.
(d) Amounts are recorded to electric fuel and purchased power. These derivative settlement gains and losses are shared with electric customers through fuel and
purchased energy cost-recovery mechanisms, and reclassified out of income as regulatory assets or liabilities, as appropriate.
(e) Amounts for the years ended Dec. 31, 2012 and 2011 included $5.0 million and $12.7 million, respectively, of settlement losses on derivatives entered to mitigate
natural gas price risk for electric generation, recorded to electric fuel and purchased power, subject to cost-recovery mechanisms and reclassified to a regulatory
asset, as appropriate. Such losses for the year ended Dec. 31, 2013 were immaterial. The remaining settlement losses for the years ended Dec. 31, 2013, 2012 and
2011 relate to natural gas operations and are recorded to cost of natural gas sold and transported. These losses are subject to cost-recovery mechanisms and
reclassified out of income to a regulatory asset, as appropriate.
Xcel Energy had no derivative instruments designated as fair value hedges during the years ended Dec. 31, 2013, 2012 and 2011.
Therefore, no gains or losses from fair value hedges or related hedged transactions were recognized for these periods.
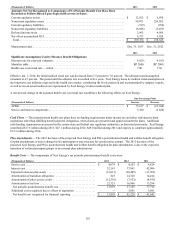
Credit Related Contingent Features — Contract provisions for derivative instruments that the utility subsidiaries enter, including
those recorded to the consolidated balance sheet at fair value, as well as those accounted for as normal purchase-normal sale contracts
and therefore not reflected on the balance sheet, may require the posting of collateral or settlement of the contracts for various reasons,
including if the applicable utility subsidiary is unable to maintain its credit ratings. If the credit ratings of Xcel Energy Inc.’s utility
subsidiaries were downgraded below investment grade, derivative instruments reflected in a $1.4 million and $4.6 million gross
liability position on the consolidated balance sheets at Dec. 31, 2013 and 2012, respectively, would have required Xcel Energy Inc.’s
utility subsidiaries to post collateral or settle outstanding contracts, including other contracts subject to master netting agreements,
which would have resulted in payments of $1.4 million and $4.6 million at Dec. 31, 2013 and 2012, respectively. At Dec. 31, 2013
and 2012, there was no collateral posted on these specific contracts.