Xcel Energy 2013 Annual Report Download - page 112
Download and view the complete annual report
Please find page 112 of the 2013 Xcel Energy annual report below. You can navigate through the pages in the report by either clicking on the pages listed below, or by using the keyword search tool below to find specific information within the annual report.-
 1
1 -
2
-
3
-
4
-
5
-
6
-
7
-
8
-
9
-
10
-
11
-
12
-
13
-
14
-
15
-
16
-
17
-
18
-
19
-
20
-
21
-
22
-
23
-
24
-
25
-
26
-
27
-
28
-
29
-
30
-
31
-
32
-
33
-
34
-
35
-
36
-
37
-
38
-
39
-
40
-
41
-
42
-
43
-
44
-
45
-
46
-
47
-
48
-
49
-
50
-
51
-
52
-
53
-
54
-
55
-
56
-
57
-
58
-
59
-
60
-
61
-
62
-
63
-
64
-
65
-
66
-
67
-
68
-
69
-
70
-
71
-
72
-
73
-
74
-
75
-
76
-
77
-
78
-
79
-
80
-
81
-
82
-
83
-
84
-
85
-
86
-
87
-
88
-
89
-
90
-
91
-
92
-
93
-
94
-
95
-
96
-
97
-
98
-
99
-
100
-
101
-
 102
102 -
 103
103 -
 104
104 -
 105
105 -
 106
106 -
 107
107 -
 108
108 -
 109
109 -
 110
110 -
 111
111 -
 112
112 -
 113
113 -
 114
114 -
 115
115 -
 116
116 -
 117
117 -
 118
118 -
 119
119 -
 120
120 -
 121
121 -
 122
122 -
123
-
124
-
125
-
126
-
127
-
128
-
129
-
130
-
131
-
132
-
133
-
134
-
135
-
136
-
137
-
138
-
139
-
140
-
141
-
142
-
143
-
144
-
145
-
146
-
147
-
148
-
149
-
150
-
151
-
152
-
153
-
154
-
155
-
156
-
157
-
158
-
159
-
160
-
161
-
162
-
163
-
164
-
165
-
166
-
167
-
168
-
169
-
170
-
171
-
172
-
173
-
174
-
175
-
176
-
177
-
178
-
179
-
180
 |
 |

94
Xcel Energy depends on its subsidiaries to pay dividends. All of Xcel Energy Inc.’s utility subsidiaries’ dividends are subject to the
FERC’s jurisdiction under the Federal Power Act, which prohibits the payment of dividends out of capital accounts; payment of
dividends is allowed out of retained earnings only. Due to certain restrictive covenants, Xcel Energy Inc. is required to be current on
particular interest payments before dividends can be paid.
As discussed below, the most restrictive dividend limitations for NSP-Minnesota, NSP-Wisconsin and SPS are imposed by their
respective state regulatory commission. PSCo’s dividends are subject to the FERC’s jurisdiction under the Federal Power Act, which
prohibits the payment of dividends out of capital accounts; payment of dividends is allowed out of retained earnings only.
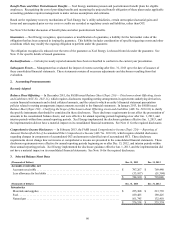
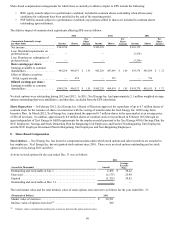
Only NSP-Minnesota has a first mortgage indenture which places certain restrictions on the amount of cash dividends it can pay to
Xcel Energy Inc., the holder of its common stock. Even with this restriction, NSP-Minnesota could have paid more than $1.4 billion
and $1.3 billion in additional cash dividends to Xcel Energy Inc. at Dec. 31, 2013 and 2012, respectively.
NSP-Minnesota’s state regulatory commissions indirectly limit the amount of dividends NSP-Minnesota can pay by requiring an
equity-to-total capitalization ratio between 46.8 percent and 57.2 percent. NSP-Minnesota’s equity-to-total capitalization ratio was
52.5 percent at Dec. 31, 2013 and $912 million in retained earnings was not restricted. Total capitalization for NSP-Minnesota was
$8.5 billion at Dec. 31, 2013, which did not exceed the limit of $9.0 billion.
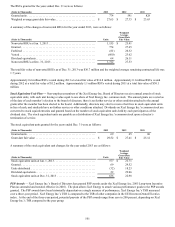
NSP-Wisconsin cannot pay annual dividends in excess of approximately $31.2 million if its calendar year average equity-to-total
capitalization ratio is or falls below the state commission authorized level of 52.5 percent, as calculated consistent with PSCW
requirements. NSP-Wisconsin’s calendar year average equity-to-total capitalization ratio calculated on this basis was 52.8 percent at
Dec. 31, 2013 and $17.1 million in retained earnings was not restricted.
SPS’ state regulatory commissions indirectly limit the amount of dividends that SPS can pay Xcel Energy Inc. by requiring an equity-
to-total capitalization ratio (excluding short-term debt) between 45.0 percent and 55.0 percent. In addition, SPS may not pay a
dividend that would cause it to lose its investment grade bond rating. SPS’ equity-to-total capitalization ratio (excluding short-term
debt) was 53.2 percent at Dec. 31, 2013 and $359 million in retained earnings was not restricted.
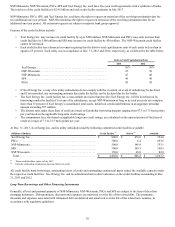
The issuance of securities by Xcel Energy Inc. generally is not subject to regulatory approval. However, utility financings and certain
intra-system financings are subject to the jurisdiction of the applicable state regulatory commissions and/or the FERC under the
Federal Power Act.
• PSCo currently has authorization to issue up to an additional $1 billion of long-term debt and up to $800 million of short-term
debt.
• SPS currently has no authorization to issue any long-term debt in 2014 and up to $400 million of short-term debt.
• NSP-Wisconsin currently has authorization to issue up to an additional $150 million of long-term debt and up to $150 million
of short-term debt.
• NSP-Minnesota has authorization to issue long-term securities provided the equity-to-total capitalization ratio remains between
46.8 percent and 57.2 percent and to issue short-term debt provided it does not exceed 15 percent of total capitalization. Total
capitalization for NSP-Minnesota cannot exceed $9 billion.
Xcel Energy believes these authorizations are adequate and will seek additional authorization when necessary; however, there can be
no assurance that additional authorization will be granted on the timeframe or in the amounts requested.
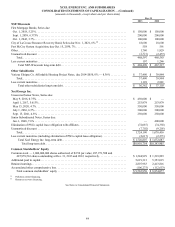
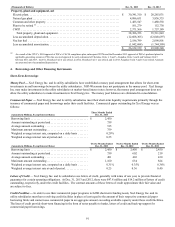
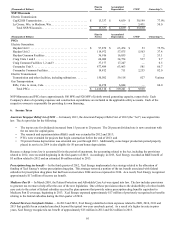
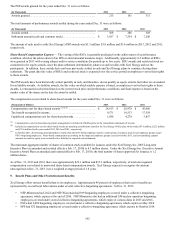
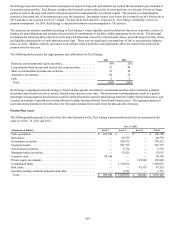
5. Joint Ownership of Generation, Transmission and Gas Facilities
Following are the investments by Xcel Energy Inc.’s utility subsidiaries in jointly owned generation, transmission and gas facilities
and the related ownership percentages as of Dec. 31, 2013:
(Thousands of Dollars) Plant in
Service Accumulated
Depreciation CWIP Ownership %
NSP-Minnesota
Electric Generation:
Sherco Unit 3 . . . . . . . . . . . . . . . . . . . . . . . . . . . . . . . . . . . . . . . . . $ 596,314 $ 371,925 $ 4,533 59.0%
Sherco Common Facilities Units 1, 2 and 3 . . . . . . . . . . . . . . . . . 145,579 87,289 61 80.0
Sherco Substation. . . . . . . . . . . . . . . . . . . . . . . . . . . . . . . . . . . . . . 4,790 2,884 — 59.0
Electric Transmission:
Grand Meadow Line and Substation . . . . . . . . . . . . . . . . . . . . . . . 10,647 1,225 — 50.0
CapX2020 Transmission . . . . . . . . . . . . . . . . . . . . . . . . . . . . . . . . 340,333 77,803 503,714 53.3
Total NSP-Minnesota . . . . . . . . . . . . . . . . . . . . . . . . . . . . . . . . $ 1,097,663 $ 541,126 $ 508,308