Xcel Energy 2013 Annual Report Download - page 2
Download and view the complete annual report
Please find page 2 of the 2013 Xcel Energy annual report below. You can navigate through the pages in the report by either clicking on the pages listed below, or by using the keyword search tool below to find specific information within the annual report.-
 1
1 -
 2
2 -
 3
3 -
 4
4 -
 5
5 -
 6
6 -
 7
7 -
 8
8 -
 9
9 -
 10
10 -
 11
11 -
 12
12 -
 13
13 -
14
-
15
-
16
-
17
-
18
-
19
-
20
-
21
-
22
-
23
-
24
-
25
-
26
-
27
-
28
-
29
-
30
-
31
-
32
-
33
-
34
-
35
-
36
-
37
-
38
-
39
-
40
-
41
-
42
-
43
-
44
-
45
-
46
-
47
-
48
-
49
-
50
-
51
-
52
-
53
-
54
-
55
-
56
-
57
-
58
-
59
-
60
-
61
-
62
-
63
-
64
-
65
-
66
-
67
-
68
-
69
-
70
-
71
-
72
-
73
-
74
-
75
-
76
-
77
-
78
-
79
-
80
-
81
-
82
-
83
-
84
-
85
-
86
-
87
-
88
-
89
-
90
-
91
-
92
-
93
-
94
-
95
-
96
-
97
-
98
-
99
-
100
-
101
-
102
-
103
-
104
-
105
-
106
-
107
-
108
-
109
-
110
-
111
-
112
-
113
-
114
-
115
-
116
-
117
-
118
-
119
-
120
-
121
-
122
-
123
-
124
-
125
-
126
-
127
-
128
-
129
-
130
-
131
-
132
-
133
-
134
-
135
-
136
-
137
-
138
-
139
-
140
-
141
-
142
-
143
-
144
-
145
-
146
-
147
-
148
-
149
-
150
-
151
-
152
-
153
-
154
-
155
-
156
-
157
-
158
-
159
-
160
-
161
-
162
-
163
-
164
-
165
-
166
-
167
-
168
-
169
-
170
-
171
-
172
-
173
-
174
-
175
-
176
-
177
-
178
-
179
-
180
 |
 |

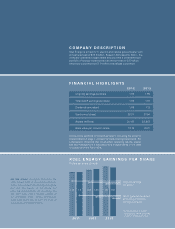
COMPANY DESCRIPTION
Xcel Energy is a major U.S. electric and natural gas company, with
annual revenues of $10.9 billion. Based in Minneapolis, Minn., the
company operates in eight states and provides a comprehensive
portfolio of energy-related products and services to 3.5 million
electricity customers and 1.9 million natural gas customers.
On the Cover: As lights illuminate the
16th Street Mall in downtown Denver,
Colo., the people of Xcel Energy recognize
not only the beauty of the scene but
also the responsibility of providing the
city with safe, clean, reliable energy at
an affordable price. Those employees
work hard every day to earn the trust of
customers and shareholders.
Some of the sections in this annual report, including the letter to
shareholders on page 1, contain forward-looking statements. For
a discussion of factors that could affect operating results, please
see the management’s discussion and analysis listed in the table
of contents of the Form 10-K.
FINANCIAL HIGHLIGHTS
Ongoing earnings per share 1.82 1.95
Stock price (close) 26.71 27.94
Total GAAP earnings per share 1.85 1.91
Assets (millions) 31,141 33,907
Dividends annualized 1.08 1.12
Book value per common share 18.19 19.21
2012 2013
XCEL ENERGY EARNINGS PER SHARE
Dollars per share (diluted)
2 011 2012 2013
Ongoing earnings
per share*
* A reconciliation to GAAP
earnings per share is located
in Item 7 of the Form 10-K.
GAAP (generally accepted
accounting principles)
earnings per share
1.72 1.82 1.951.2 1.85 1.91