Xcel Energy 2013 Annual Report Download - page 134
Download and view the complete annual report
Please find page 134 of the 2013 Xcel Energy annual report below. You can navigate through the pages in the report by either clicking on the pages listed below, or by using the keyword search tool below to find specific information within the annual report.-
 1
1 -
2
-
3
-
4
-
5
-
6
-
7
-
8
-
9
-
10
-
11
-
12
-
13
-
14
-
15
-
16
-
17
-
18
-
19
-
20
-
21
-
22
-
23
-
24
-
25
-
26
-
27
-
28
-
29
-
30
-
31
-
32
-
33
-
34
-
35
-
36
-
37
-
38
-
39
-
40
-
41
-
42
-
43
-
44
-
45
-
46
-
47
-
48
-
49
-
50
-
51
-
52
-
53
-
54
-
55
-
56
-
57
-
58
-
59
-
60
-
61
-
62
-
63
-
64
-
65
-
66
-
67
-
68
-
69
-
70
-
71
-
72
-
73
-
74
-
75
-
76
-
77
-
78
-
79
-
80
-
81
-
82
-
83
-
84
-
85
-
86
-
87
-
88
-
89
-
90
-
91
-
92
-
93
-
94
-
95
-
96
-
97
-
98
-
99
-
100
-
101
-
102
-
103
-
104
-
105
-
106
-
107
-
108
-
109
-
110
-
111
-
112
-
113
-
114
-
115
-
116
-
117
-
118
-
119
-
120
-
121
-
122
-
123
-
 124
124 -
 125
125 -
 126
126 -
 127
127 -
 128
128 -
 129
129 -
 130
130 -
 131
131 -
 132
132 -
 133
133 -
 134
134 -
 135
135 -
 136
136 -
 137
137 -
 138
138 -
 139
139 -
 140
140 -
 141
141 -
 142
142 -
 143
143 -
 144
144 -
145
-
146
-
147
-
148
-
149
-
150
-
151
-
152
-
153
-
154
-
155
-
156
-
157
-
158
-
159
-
160
-
161
-
162
-
163
-
164
-
165
-
166
-
167
-
168
-
169
-
170
-
171
-
172
-
173
-
174
-
175
-
176
-
177
-
178
-
179
-
180
 |
 |

116
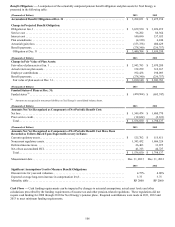
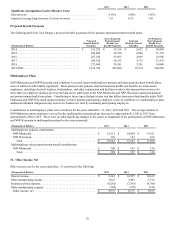
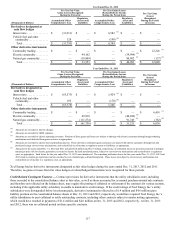
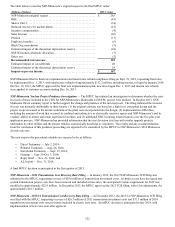
The following table details the gross notional amounts of commodity forwards, options and FTRs at Dec. 31, 2013 and 2012:
(Amounts in Thousands) (a)(b) Dec. 31, 2013 Dec. 31, 2012
MWh of electricity . . . . . . . . . . . . . . . . . . . . . . . . . . . . . . . . . . . . . . . . . . . 58,423 55,976
MMBtu of natural gas . . . . . . . . . . . . . . . . . . . . . . . . . . . . . . . . . . . . . . . . . 9,854 725
Gallons of vehicle fuel. . . . . . . . . . . . . . . . . . . . . . . . . . . . . . . . . . . . . . . . . 482 682
(a) Amounts are not reflective of net positions in the underlying commodities.
(b) Notional amounts for options are included on a gross basis, but are weighted for the probability of exercise.
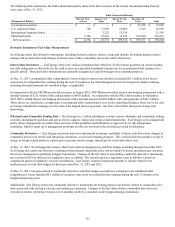
Consideration of Credit Risk and Concentrations — Xcel Energy continuously monitors the creditworthiness of the counterparties to
its interest rate derivatives and commodity derivative contracts prior to settlement, and assesses each counterparty’s ability to perform
on the transactions set forth in the contracts. Given this assessment, as well as an assessment of the impact of Xcel Energy’s own
credit risk when determining the fair value of derivative liabilities, the impact of considering credit risk was immaterial to the fair
value of unsettled commodity derivatives presented in the consolidated balance sheets.
Xcel Energy Inc. and its subsidiaries employ additional credit risk control mechanisms when appropriate, such as letters of credit,
parental guarantees, standardized master netting agreements and termination provisions that allow for offsetting of positive and
negative exposures. Credit exposure is monitored and, when necessary, the activity with a specific counterparty is limited until credit
enhancement is provided.
Xcel Energy’s utility subsidiaries’ most significant concentrations of credit risk with particular entities or industries are contracts with
counterparties to their wholesale, trading and non-trading commodity activities. At Dec. 31, 2013, four of Xcel Energy’s 10 most
significant counterparties for these activities, comprising $49.3 million or 18 percent of this credit exposure, had investment grade
credit ratings from Standard & Poor’s, Moody’s or Fitch Ratings. The remaining six significant counterparties, comprising $68.1
million or 25 percent of this credit exposure at Dec. 31, 2013, were not rated by these agencies, but based on Xcel Energy’s internal
analysis, had credit quality consistent with investment grade. All 10 of these significant counterparties are municipal or cooperative
electric entities or other utilities.
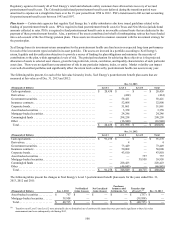
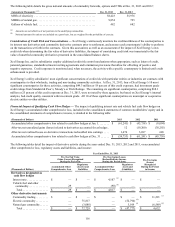
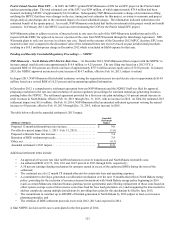
Financial Impact of Qualifying Cash Flow Hedges — The impact of qualifying interest rate and vehicle fuel cash flow hedges on
Xcel Energy’s accumulated other comprehensive loss, included in the consolidated statements of common stockholders’ equity and in
the consolidated statements of comprehensive income, is detailed in the following table:
(Thousands of Dollars) 2013 2012 2011
Accumulated other comprehensive loss related to cash flow hedges at Jan. 1. . . . . . . . $(61,241) $ (45,738) $ (8,094)
After-tax net unrealized gains (losses) related to derivatives accounted for as hedges .12 (19,200) (38,292)
After-tax net realized losses on derivative transactions reclassified into earnings. . . . . 1,476 3,697 648
Accumulated other comprehensive loss related to cash flow hedges at Dec. 31 . . . . . . $(59,753) $ (61,241) $ (45,738)
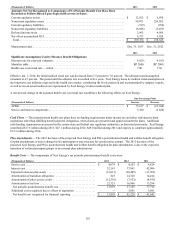
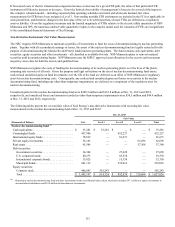
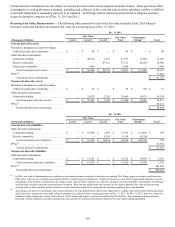
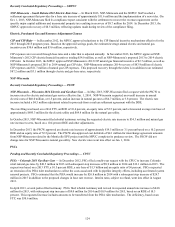
The following tables detail the impact of derivative activity during the years ended Dec. 31, 2013, 2012 and 2011, on accumulated
other comprehensive loss, regulatory assets and liabilities, and income:
Year Ended Dec. 31, 2013
Pre-Tax Fair Value
Gains (Losses) Recognized
During the Period in:
Pre-Tax (Gains) Losses
Reclassified into Income
During the Period from: Pre-Tax Gains
(Losses)
Recognized
During the Period
in Income(Thousands of Dollars) Accumulated Other
Comprehensive Loss
Regulatory
(Assets) and
Liabilities Accumulated Other
Comprehensive Loss
Regulatory
Assets and
(Liabilities)
Derivatives designated as
cash flow hedges
Interest rate . . . . . . . . . . . . . . . $ — $ — $ 4,107 (a) $ — $ —
Vehicle fuel and other
commodity. . . . . . . . . . . . . . 29 — (90)(b) — —
Total . . . . . . . . . . . . . . . . . . $ 29 $ — $ 4,017 $ — $ —
Other derivative instruments
Commodity trading . . . . . . . . . $ — $ — $ — $ — $ 11,221 (c)
Electric commodity. . . . . . . . . — 75,817 — (52,796)(d) —
Natural gas commodity. . . . . . — (3,088) — 5,019 (e) (6,589) (d)
Total . . . . . . . . . . . . . . . . . . $ — $ 72,729 $ — $ (47,777) $ 4,632