XM Radio 2008 Annual Report Download - page 8
Download and view the complete annual report
Please find page 8 of the 2008 XM Radio annual report below. You can navigate through the pages in the report by either clicking on the pages listed below, or by using the keyword search tool below to find specific information within the annual report.-
 1
1 -
 2
2 -
 3
3 -
 4
4 -
 5
5 -
 6
6 -
 7
7 -
 8
8 -
 9
9 -
 10
10 -
 11
11 -
 12
12 -
 13
13 -
 14
14 -
 15
15 -
 16
16 -
 17
17 -
 18
18 -
 19
19 -
20
-
21
-
22
-
23
-
24
-
25
-
26
-
27
-
28
-
29
-
30
-
31
-
32
-
33
-
34
-
35
-
36
-
37
-
38
-
39
-
40
-
41
-
42
-
43
-
44
-
45
-
46
-
47
-
48
-
49
-
50
-
51
-
52
-
53
-
54
-
55
-
56
-
57
-
58
-
59
-
60
-
61
-
62
-
63
-
64
-
65
-
66
-
67
-
68
-
69
-
70
-
71
-
72
-
73
-
74
-
75
-
76
-
77
-
78
-
79
-
80
-
81
-
82
-
83
-
84
-
85
-
86
-
87
-
88
-
89
-
90
-
91
-
92
-
93
-
94
-
95
-
96
-
97
-
98
-
99
-
100
-
101
-
102
-
103
-
104
-
105
-
106
-
107
-
108
-
109
-
110
-
111
-
112
-
113
-
114
-
115
-
116
-
117
-
118
-
119
-
120
-
121
-
122
-
123
-
124
-
125
-
126
-
127
-
128
-
129
-
130
-
131
-
132
-
133
-
134
-
135
-
136
-
137
-
138
-
139
-
140
-
141
-
142
-
143
-
144
-
145
-
146
-
147
-
148
-
149
-
150
-
151
-
152
-
153
-
154
-
155
-
156
-
157
-
158
-
159
-
160
-
161
-
162
-
163
-
164
-
165
-
166
-
167
-
168
-
169
-
170
-
171
-
172
-
173
-
174
-
175
-
176
-
177
-
178
-
179
-
180
-
181
-
182
-
183
-
184
-
185
-
186
-
187
-
188
 |
 |

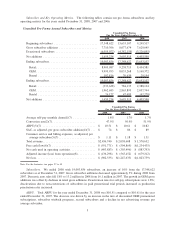
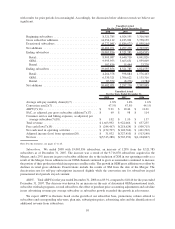
SAC, As Adjusted, Per Gross Subscriber Addition. SAC, as adjusted, per gross subscriber addition improved
by 14% to $74 from $86 for the years ended December 31, 2008 and 2007, respectively. The decrease was primarily
driven by lower retail and OEM subsidies due to better product economics and improved equipment margin.
Customer Service and Billing Expenses, As Adjusted, Per Average Subscriber. Customer service and billing
expenses, as adjusted, per average subscriber improved 6% to $1.11 for the year ended December 31, 2008
compared with $1.18 for the year ended December 31, 2007. The decline was primarily due to efficiencies across a
larger subscriber base.
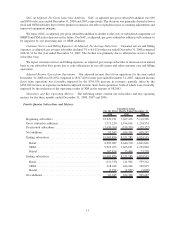
Unaudited Pro Forma Results of Operations. Set forth below are certain pro forma items that give effect to
the Merger as if it had occurred on January 1, 2006. The pro forma information below does not give effect to any
adjustments as a result of the purchase price accounting for the Merger, nor the goodwill impairment charge taken
during 2008. See footnote 8 for a reconciliation of net loss to adjusted income (loss) from operations.
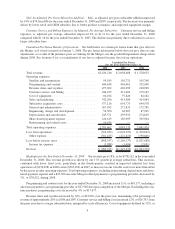
2008 2007 2006
Unaudited Pro Forma
For the Years Ended December 31,
Total revenue................................. $2,436,740 $ 2,058,608 $ 1,570,652
Operating expenses:
Satellite and transmission ...................... 99,185 101,721 105,768
Programming and content...................... 446,638 401,461 352,968
Revenue share and royalties .................... 477,962 403,059 218,928
Customer service and billing ................... 244,195 217,402 179,183
Cost of equipment ........................... 66,104 97,820 84,182
Sales and marketing .......................... 342,296 413,084 414,984
Subscriber acquisition costs .................... 577,126 654,775 644,578
General and administrative ..................... 267,032 271,831 172,785
Engineering, design and development ............. 52,500 62,907 87,505
Depreciation and amortization .................. 245,571 293,976 274,629
Share-based payment expense................... 124,619 165,099 505,964
Restructuring and related costs .................. 10,434 — —
Total operating expenses ........................ 2,953,662 3,083,135 3,041,474
Loss from operations ........................... (516,922) (1,024,527) (1,470,822)
Other expense .............................. (381,425) (221,610) (350,866)
Loss before income taxes........................ (898,347) (1,246,137) (1,821,688)
Income tax expense .......................... (3,988) (1,496) (2,051)
Net loss. . . .................................. $(902,335) $(1,247,633) $(1,823,739)
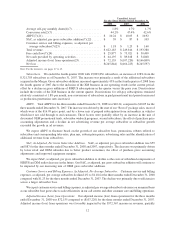
Highlights for the Year Ended December 31, 2008. Our revenue grew 18%, or by $378,132, in the year ended
December 31, 2008. This revenue growth was driven by our 17% growth in average subscribers. This increase,
combined with lower fixed costs, particularly in the fourth quarter, resulted in improved adjusted loss from
operations of ($136,298) in 2008 versus ($565,452) in 2007, as increases in our variable costs were more than offset
by decreases in other operating expenses. Total operating expenses, excluding restructuring, depreciation and share-
based payment expense and a $27,500 one-time Merger related payment to a programming provider, decreased by
3%, or $78,522, during 2008.
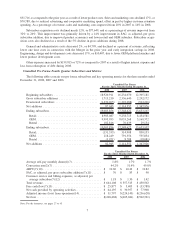
Programming and content costs for the year ended December 31, 2008 increased 11%, or $45,177, including a
one-time payment to a programming provider of $27,500 due upon completion of the Merger. Excluding this one-
time payment, programming costs increased by 4% or $17,677.
Revenue share and royalties increased by 19%, or $74,903, over the prior year, maintaining a flat percentage of
revenue of approximately 20% in 2008 and 2007. Customer service and billing costs increased 12%, or $26,793, from
the prior year due to a larger subscriber base, mitigated by scale efficiencies. Cost of equipment declined by 32%, or
6