XM Radio 2008 Annual Report Download - page 7
Download and view the complete annual report
Please find page 7 of the 2008 XM Radio annual report below. You can navigate through the pages in the report by either clicking on the pages listed below, or by using the keyword search tool below to find specific information within the annual report.-
 1
1 -
 2
2 -
 3
3 -
 4
4 -
 5
5 -
 6
6 -
 7
7 -
 8
8 -
 9
9 -
 10
10 -
 11
11 -
 12
12 -
 13
13 -
 14
14 -
 15
15 -
 16
16 -
 17
17 -
 18
18 -
19
-
20
-
21
-
22
-
23
-
24
-
25
-
26
-
27
-
28
-
29
-
30
-
31
-
32
-
33
-
34
-
35
-
36
-
37
-
38
-
39
-
40
-
41
-
42
-
43
-
44
-
45
-
46
-
47
-
48
-
49
-
50
-
51
-
52
-
53
-
54
-
55
-
56
-
57
-
58
-
59
-
60
-
61
-
62
-
63
-
64
-
65
-
66
-
67
-
68
-
69
-
70
-
71
-
72
-
73
-
74
-
75
-
76
-
77
-
78
-
79
-
80
-
81
-
82
-
83
-
84
-
85
-
86
-
87
-
88
-
89
-
90
-
91
-
92
-
93
-
94
-
95
-
96
-
97
-
98
-
99
-
100
-
101
-
102
-
103
-
104
-
105
-
106
-
107
-
108
-
109
-
110
-
111
-
112
-
113
-
114
-
115
-
116
-
117
-
118
-
119
-
120
-
121
-
122
-
123
-
124
-
125
-
126
-
127
-
128
-
129
-
130
-
131
-
132
-
133
-
134
-
135
-
136
-
137
-
138
-
139
-
140
-
141
-
142
-
143
-
144
-
145
-
146
-
147
-
148
-
149
-
150
-
151
-
152
-
153
-
154
-
155
-
156
-
157
-
158
-
159
-
160
-
161
-
162
-
163
-
164
-
165
-
166
-
167
-
168
-
169
-
170
-
171
-
172
-
173
-
174
-
175
-
176
-
177
-
178
-
179
-
180
-
181
-
182
-
183
-
184
-
185
-
186
-
187
-
188
 |
 |

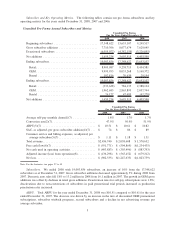
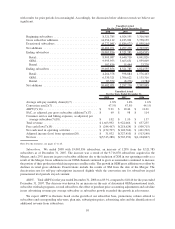
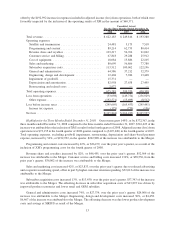
Subscriber and Key Operating Metrics. The following tables contain our pro forma subscribers and key
operating metrics for the years ended December 31, 2008, 2007 and 2006:
Unaudited Pro Forma Annual Subscribers and Metrics:
2008 2007 2006
Unaudited Pro Forma
For the Years Ended December 31,
Beginning subscribers ........................... 17,348,622 13,653,107 9,249,517
Gross subscriber additions ........................ 7,710,306 8,077,674 7,629,645
Deactivated subscribers .......................... (6,055,072) (4,382,159) (3,226,055)
Net additions .................................. 1,655,234 3,695,515 4,403,590
Ending subscribers .............................. 19,003,856 17,348,622 13,653,107
Retail...................................... 8,905,087 9,238,715 8,454,581
OEM...................................... 9,995,953 8,033,268 5,169,372
Rental ..................................... 102,816 76,639 29,154
Ending subscribers .............................. 19,003,856 17,348,622 13,653,107
Retail...................................... (333,628) 784,135 2,388,124
OEM...................................... 1,962,685 2,863,895 2,057,744
Rental ..................................... 26,177 47,485 (42,278)
Net additions .................................. 1,655,234 3,695,515 4,403,590
2008 2007 2006
Unaudited Pro Forma
For the Years Ended December 31,
Average self-pay monthly churn(1)(7) .............. 1.8% 1.7% 1.7%
Conversion rate(2)(7) ........................... 47.5% 50.9% 51.9%
ARPU(3)(7) ................................. $ 10.51 $ 10.61 $ 10.82
SAC, as adjusted, per gross subscriber addition(4)(7) . . . $ 74 $ 86 $ 89
Customer service and billing expenses, as adjusted, per
average subscriber(5)(7) ....................... $ 1.11 $ 1.18 $ 1.31
Total revenue................................. $2,436,740 $ 2,058,608 $ 1,570,652
Free cash flow(6)(7) ........................... $ (551,771) $ (504,869) $(1,234,435)
Net cash used in operating activities................ $ (403,883) $ (303,496) $ (883,793)
Adjusted income (loss) from operations(8) ........... $ (136,298) $ (565,452) $ (679,312)
Net loss. . . .................................. $(902,335) $(1,247,633) $(1,823,739)
Note: For the footnotes, see pages 27 to 45
Subscribers. We ended 2008 with 19,003,856 subscribers, an increase of 10% from the 17,348,622
subscribers as of December 31, 2007. Gross subscriber additions decreased approximately 5% during 2008 from
2007. Domestic auto sales fell 18% to 13.2 million in 2008 from 16.1 million in 2007. The growth in OEM gross
additions was offset by declines in retail gross additions. Deactivation rates for self-pay subscriptions were 1.8%;
deactivations due to non-conversions of subscribers in paid promotional trial periods increased as production
penetration rates increased.
ARPU. Total ARPU for the year ended December 31, 2008 was $10.51 compared to $10.61 for the year
ended December 31, 2007. The decrease was driven by an increase in the mix of discounted OEM promotional
subscriptions, subscriber winback programs, second subscribers and a decline in net advertising revenue per
average subscriber.
5