XM Radio 2008 Annual Report Download - page 33
Download and view the complete annual report
Please find page 33 of the 2008 XM Radio annual report below. You can navigate through the pages in the report by either clicking on the pages listed below, or by using the keyword search tool below to find specific information within the annual report.-
 1
1 -
2
-
3
-
4
-
5
-
6
-
7
-
8
-
9
-
10
-
11
-
12
-
13
-
14
-
15
-
16
-
17
-
18
-
19
-
20
-
21
-
22
-
 23
23 -
 24
24 -
 25
25 -
 26
26 -
 27
27 -
 28
28 -
 29
29 -
 30
30 -
 31
31 -
 32
32 -
 33
33 -
 34
34 -
 35
35 -
 36
36 -
 37
37 -
 38
38 -
 39
39 -
 40
40 -
 41
41 -
 42
42 -
 43
43 -
44
-
45
-
46
-
47
-
48
-
49
-
50
-
51
-
52
-
53
-
54
-
55
-
56
-
57
-
58
-
59
-
60
-
61
-
62
-
63
-
64
-
65
-
66
-
67
-
68
-
69
-
70
-
71
-
72
-
73
-
74
-
75
-
76
-
77
-
78
-
79
-
80
-
81
-
82
-
83
-
84
-
85
-
86
-
87
-
88
-
89
-
90
-
91
-
92
-
93
-
94
-
95
-
96
-
97
-
98
-
99
-
100
-
101
-
102
-
103
-
104
-
105
-
106
-
107
-
108
-
109
-
110
-
111
-
112
-
113
-
114
-
115
-
116
-
117
-
118
-
119
-
120
-
121
-
122
-
123
-
124
-
125
-
126
-
127
-
128
-
129
-
130
-
131
-
132
-
133
-
134
-
135
-
136
-
137
-
138
-
139
-
140
-
141
-
142
-
143
-
144
-
145
-
146
-
147
-
148
-
149
-
150
-
151
-
152
-
153
-
154
-
155
-
156
-
157
-
158
-
159
-
160
-
161
-
162
-
163
-
164
-
165
-
166
-
167
-
168
-
169
-
170
-
171
-
172
-
173
-
174
-
175
-
176
-
177
-
178
-
179
-
180
-
181
-
182
-
183
-
184
-
185
-
186
-
187
-
188
 |
 |

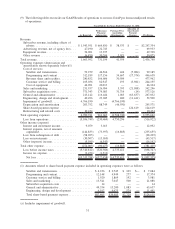
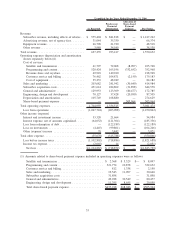
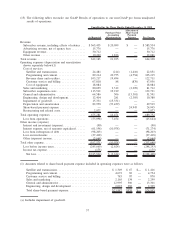
(9) The following tables reconcile our GAAP Results of operations to our non-GAAP pro forma unadjusted results
of operations:
As Reported
Predecessor
Financial
Information
Purchase Price
Accounting
Adjustments(a)
Allocation of
Share-based
Payment
Expense Pro Forma
Unaudited for the Years Ended December 31, 2008
Revenue:
Subscriber revenue, including effects of
rebates . . . . . . . . . . . . . . . . . . . . . . . . . $ 1,543,951 $ 664,850 $ 38,533 $ — $2,247,334
Advertising revenue, net of agency fees . . . 47,190 22,743 — — 69,933
Equipment revenue . . . . . . . . . . . . . . . . . . 56,001 13,397 — — 69,398
Other revenue . . . . . . . . . . . . . . . . . . . . . . 16,850 30,204 3,021 — 50,075
Total revenue . . . . . . . . . . . . . . . . . . . . . . . . 1,663,992 731,194 41,554 — 2,436,740
Operating expenses (depreciation and
amortization shown separately below)(1)
Cost of services:
Satellite and transmission. . . . . . . . . . . . 59,279 46,566 424 (7,084) 99,185
Programming and content . . . . . . . . . . . 312,189 117,156 34,667 (17,374) 446,638
Revenue share and royalties . . . . . . . . . . 280,852 166,606 30,504 — 477,962
Customer service and billing . . . . . . . . . 165,036 82,947 193 (3,981) 244,195
Cost of equipment . . . . . . . . . . . . . . . . . 46,091 20,013 — — 66,104
Sales and marketing . . . . . . . . . . . . . . . . . 231,937 126,054 5,393 (21,088) 342,296
Subscriber acquisition costs . . . . . . . . . . . . 371,343 174,083 31,714 (14) 577,126
General and administrative . . . . . . . . . . . . 213,142 116,444 1,083 (63,637) 267,032
Engineering, design and development. . . . . 40,496 23,045 400 (11,441) 52,500
Impairment of goodwill . . . . . . . . . . . . . . . 4,766,190 — (4,766,190) — —
Depreciation and amortization . . . . . . . . . . 203,752 88,749 (46,930) — 245,571
Share-based payment expense . . . . . . . . . . — — — 124,619 124,619
Restructuring and related costs . . . . . . . . . 10,434 — — — 10,434
Total operating expenses . . . . . . . . . . . . . . . . 6,700,741 961,663 (4,708,742) — 2,953,662
Loss from operations . . . . . . . . . . . . . . . . . (5,036,749) (230,469) 4,750,296 — (516,922)
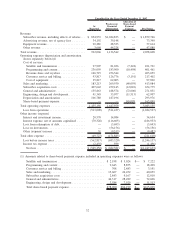
Other income (expense)
Interest and investment income . . . . . . . . . 9,079 3,013 — — 12,092
Interest expense, net of amounts
capitalized . . . . . . . . . . . . . . . . . . . . . . . (144,833) (73,937) (16,885) — (235,655)
Loss from redemption of debt . . . . . . . . . . (98,203) — — — (98,203)
Loss on investments . . . . . . . . . . . . . . . . . (30,507) (13,010) — — (43,517)
Other (expense) income . . . . . . . . . . . . . . . (9,599) (6,543) — — (16,142)
Total other expense . . . . . . . . . . . . . . . . . . . . (274,063) (90,477) (16,885) — (381,425)
Loss before income taxes . . . . . . . . . . . . . (5,310,812) (320,946) 4,733,411 — (898,347)
Income tax expense . . . . . . . . . . . . . . . . . . (2,476) (1,512) — — (3,988)
Net loss . . . . . . . . . . . . . . . . . . . . . . . . $(5,313,288) $(322,458) $ 4,733,411 $ — $ (902,335)
(1) Amounts related to share-based payment expense included in operating expenses were as follows:
Satellite and transmission . . . . . . . . . . . . . . . . . . . . . . $ 4,236 $ 2,745 $ 103 $— $ 7,084
Programming and content . . . . . . . . . . . . . . . . . . . . . . 12,148 4,949 277 — 17,374
Customer service and billing . . . . . . . . . . . . . . . . . . . 1,920 1,869 192 — 3,981
Sales and marketing . . . . . . . . . . . . . . . . . . . . . . . . . . 13,541 7,047 500 — 21,088
Subscriber acquisition costs . . . . . . . . . . . . . . . . . . . . 14 — — — 14
General and administrative . . . . . . . . . . . . . . . . . . . . . 49,354 13,200 1,083 — 63,637
Engineering, design and development . . . . . . . . . . . . . 6,192 4,675 574 — 11,441
Total share-based payment expense . . . . . . . . . . . . . . . $87,405 $34,485 $2,729 $— $124,619
(a) Includes impairment of goodwill.
31