XM Radio 2008 Annual Report Download - page 58
Download and view the complete annual report
Please find page 58 of the 2008 XM Radio annual report below. You can navigate through the pages in the report by either clicking on the pages listed below, or by using the keyword search tool below to find specific information within the annual report.-
 1
1 -
2
-
3
-
4
-
5
-
6
-
7
-
8
-
9
-
10
-
11
-
12
-
13
-
14
-
15
-
16
-
17
-
18
-
19
-
20
-
21
-
22
-
23
-
24
-
25
-
26
-
27
-
28
-
29
-
30
-
31
-
32
-
33
-
34
-
35
-
36
-
37
-
38
-
39
-
40
-
41
-
42
-
43
-
44
-
45
-
46
-
47
-
 48
48 -
 49
49 -
 50
50 -
 51
51 -
 52
52 -
 53
53 -
 54
54 -
 55
55 -
 56
56 -
 57
57 -
 58
58 -
 59
59 -
 60
60 -
 61
61 -
 62
62 -
 63
63 -
 64
64 -
 65
65 -
 66
66 -
 67
67 -
 68
68 -
69
-
70
-
71
-
72
-
73
-
74
-
75
-
76
-
77
-
78
-
79
-
80
-
81
-
82
-
83
-
84
-
85
-
86
-
87
-
88
-
89
-
90
-
91
-
92
-
93
-
94
-
95
-
96
-
97
-
98
-
99
-
100
-
101
-
102
-
103
-
104
-
105
-
106
-
107
-
108
-
109
-
110
-
111
-
112
-
113
-
114
-
115
-
116
-
117
-
118
-
119
-
120
-
121
-
122
-
123
-
124
-
125
-
126
-
127
-
128
-
129
-
130
-
131
-
132
-
133
-
134
-
135
-
136
-
137
-
138
-
139
-
140
-
141
-
142
-
143
-
144
-
145
-
146
-
147
-
148
-
149
-
150
-
151
-
152
-
153
-
154
-
155
-
156
-
157
-
158
-
159
-
160
-
161
-
162
-
163
-
164
-
165
-
166
-
167
-
168
-
169
-
170
-
171
-
172
-
173
-
174
-
175
-
176
-
177
-
178
-
179
-
180
-
181
-
182
-
183
-
184
-
185
-
186
-
187
-
188
 |
 |

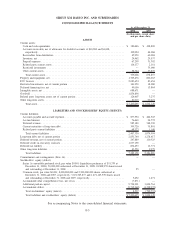
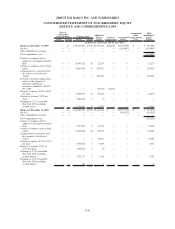
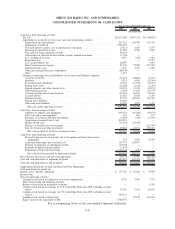
SIRIUS XM RADIO INC. AND SUBSIDIARIES
CONSOLIDATED STATEMENTS OF CASH FLOWS
2008 2007 2006
For the Years Ended December 31,
(In thousands)
Cash flows from operating activities:
Net loss ........................................................ $(5,313,288) $(565,252) $(1,104,867)
Adjustments to reconcile net loss to net cash used in operating activities:
Depreciation and amortization ........................................ 203,752 106,780 105,749
Impairment of goodwill . . . ......................................... 4,766,190 — —
Non-cash interest expense, net of amortization of premium ..................... (6,311) 4,269 3,107
Provision for doubtful accounts . . . .................................... 21,589 9,002 9,370
Non-cash loss from redemption of debt . . . ............................... 98,203 — —
Amortization of deferred income related to equity method investment . . . ........... (1,156) — —
Loss on disposal of assets . . ......................................... 4,879 (428) 1,661
Impairment loss . . . .............................................. — — 10,917
Loss on investments, net . . ......................................... 28,999 — 4,445
Share-based payment expense ........................................ 87,405 78,900 437,918
Deferred income taxes ............................................. 2,476 2,435 2,065
Other non-cash purchase price adjustments. ............................... (68,330) — —
Other ........................................................ 1,643 — —
Changes in operating assets and liabilities, net of assets and liabilities acquired:
Accounts receivable .............................................. (32,121) (28,881) (1,871)
Inventory . . ................................................... 8,291 4,965 (20,246)
Receivables from distributors ........................................ 14,401 (13,179) (20,312)
Related party assets . .............................................. (22,249) (1,241) (1,189)
Prepaid expenses and other current assets . ............................... (19,953) 11,118 (42,132)
Other long-term assets ............................................. (5,490) 13,691 (18,377)
Accounts payable and accrued expenses . . ............................... (65,481) 66,169 26,366
Accrued interest . . . .............................................. 23,081 (8,920) 1,239
Deferred revenue . . .............................................. 55,778 169,905 181,003
Related party liabilities . . . ......................................... 34,646 — —
Other long-term liabilities . . ......................................... 30,249 1,901 3,452
Net cash used in operating activities . . . ............................... (152,797) (148,766) (421,702)
Cash flows from investing activities:
Additions to property and equipment ................................... (130,551) (65,264) (92,674)
Sales of property and equipment . . .................................... 105 641 127
Purchases of restricted and other investments .............................. (3,000) (310) (12,339)
Acquisition of acquired entity cash . .................................... 819,521 — —
Merger related costs .............................................. (23,519) (29,444) —
Purchase of available-for-sale securities . . . ............................... — — (123,500)
Sale of restricted and other investments . . . ............................... 65,869 40,191 255,715
Net cash provided by (used in) investing activities ......................... 728,425 (54,186) 27,329
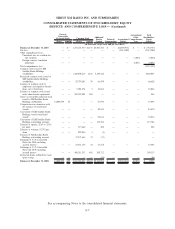
Cash flows from financing activities:
Proceeds from exercise of warrants and stock options and from share borrow
arrangement .................................................. 471 4,097 25,787
Long-term borrowings, net of related costs . ............................... 531,743 244,879 —
Payment of premiums on redemption of debt .............................. (18,693) — —
Payments to minority interest holder .................................... (1,479) — —
Repayment of long term borrowings .................................... (1,146,044) (625) —
Net cash (used in) provided by financing activities ......................... (634,002) 248,351 25,787
Net (decrease) increase in cash and cash equivalents. . . .......................... (58,374) 45,399 (368,586)
Cash and cash equivalents at beginning of period ............................... 438,820 393,421 762,007
Cash and cash equivalents at end of period ................................... $ 380,446 $ 438,820 $ 393,421
Supplemental Disclosure of Cash and Non-Cash Flow Information
Cash paid during the period for:
Interest, net of amounts capitalized ........................................ $ 137,542 $ 66,266 $ 59,929
Income taxes . . . ................................................... — — —
Non-cash operating activities:
Common stock issued in satisfaction of accrued compensation .................... 8,729 7,949 7,243
Non-cash investing and financing activities:
Release of restriction on marketable securities ............................... — — 4,750
Common stock issued in exchange of 3
1
⁄
2
% Convertible Notes due 2008, including accrued
interest ....................................................... 33,502 3,182 16,001
Common stock issued in exchange of 2
1
⁄
2
% Convertible Notes due 2009, including accrued
interest ....................................................... 209,113 2 —
Common stock issued to third parties . .................................... — 82,941 224,952
Equity issued in the acquisition of XM .................................... 5,784,976 — —
See accompanying Notes to the consolidated financial statements.
F-8