XM Radio 2008 Annual Report Download - page 14
Download and view the complete annual report
Please find page 14 of the 2008 XM Radio annual report below. You can navigate through the pages in the report by either clicking on the pages listed below, or by using the keyword search tool below to find specific information within the annual report.-
 1
1 -
2
-
3
-
 4
4 -
 5
5 -
 6
6 -
 7
7 -
 8
8 -
 9
9 -
 10
10 -
 11
11 -
 12
12 -
 13
13 -
 14
14 -
 15
15 -
 16
16 -
 17
17 -
 18
18 -
 19
19 -
 20
20 -
 21
21 -
 22
22 -
 23
23 -
 24
24 -
25
-
26
-
27
-
28
-
29
-
30
-
31
-
32
-
33
-
34
-
35
-
36
-
37
-
38
-
39
-
40
-
41
-
42
-
43
-
44
-
45
-
46
-
47
-
48
-
49
-
50
-
51
-
52
-
53
-
54
-
55
-
56
-
57
-
58
-
59
-
60
-
61
-
62
-
63
-
64
-
65
-
66
-
67
-
68
-
69
-
70
-
71
-
72
-
73
-
74
-
75
-
76
-
77
-
78
-
79
-
80
-
81
-
82
-
83
-
84
-
85
-
86
-
87
-
88
-
89
-
90
-
91
-
92
-
93
-
94
-
95
-
96
-
97
-
98
-
99
-
100
-
101
-
102
-
103
-
104
-
105
-
106
-
107
-
108
-
109
-
110
-
111
-
112
-
113
-
114
-
115
-
116
-
117
-
118
-
119
-
120
-
121
-
122
-
123
-
124
-
125
-
126
-
127
-
128
-
129
-
130
-
131
-
132
-
133
-
134
-
135
-
136
-
137
-
138
-
139
-
140
-
141
-
142
-
143
-
144
-
145
-
146
-
147
-
148
-
149
-
150
-
151
-
152
-
153
-
154
-
155
-
156
-
157
-
158
-
159
-
160
-
161
-
162
-
163
-
164
-
165
-
166
-
167
-
168
-
169
-
170
-
171
-
172
-
173
-
174
-
175
-
176
-
177
-
178
-
179
-
180
-
181
-
182
-
183
-
184
-
185
-
186
-
187
-
188
 |
 |

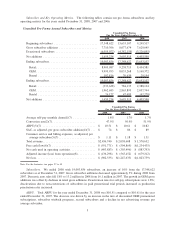
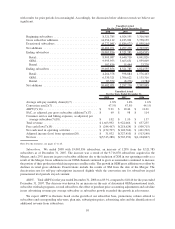
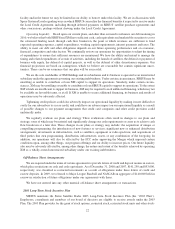
2008 2007 2006
Unaudited Actual
For the Three Months Ended December 31,
Average self-pay monthly churn(1)(7) .................. 1.8% 1.7% 1.7%
Conversion rate(2)(7) .............................. 44.2% 47.4% 42.6%
ARPU(7)(21) .................................... $ 10.24 $ 10.05 $ 10.92
SAC, as adjusted, per gross subscriber addition(7)(22) ...... $ 59 $ 87 $ 103
Customer service and billing expenses, as adjusted, per
average subscriber(7)(23) ......................... $ 1.18 $ 1.23 $ 1.60
Total revenue .................................... $622,183 $ 249,816 $ 193,380
Free cash flow(7)(24) .............................. $ 25,877 $ 75,921 $ 30,409
Net cash provided by operating activities................ $ 64,195 $ 89,818 $ 34,868
Adjusted income (loss) from operations(25).............. $ 72,155 $(107,220) $(166,809)
Net loss . ....................................... $(245,844) $(166,223) $(245,597)
Note: For the footnotes, see pages 27 to 45.
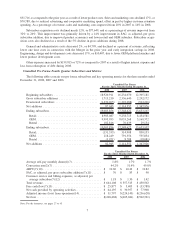
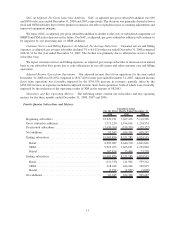
Subscribers. We ended the fourth quarter 2008 with 19,003,856 subscribers, an increase of 128% from the
8,321,785 subscribers as of December 31, 2007. The increase was primarily a result of the additional subscribers
acquired in the Merger. Gross subscriber additions increased approximately 43% in the fourth quarter of 2008 from
the fourth quarter of 2007 due to the inclusion of the XM business in our operating results in the current period;
offset by a decline in gross additions of SIRIUS subscriptions in the quarter versus the prior year. Deactivations
include the results of the XM business in the current quarter. Deactivations for self-pay subscriptions remained
relatively consistent at 1.8% per month; non-conversions of subscribers in paid promotional trial periods increased
as production penetration rates increased.
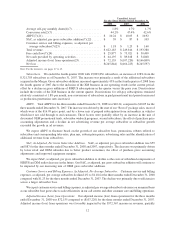
ARPU. Total ARPU for the three months ended December 31, 2008 was $10.24, compared to $10.05 for the
three months ended December 31, 2007. The increase was driven by the start of our “Best of” package sales, most of
which were at the $16.99 price point, and by a lower mix of prepaid subscriptions from automakers in vehicles
which have not sold through to end customers. These factors were partially offset by an increase in the mix of
discounted OEM promotional trials, subscriber winback programs, second subscribers, the effect of purchase price
accounting adjustments and a decline in net advertising revenue per average subscriber as subscriber growth
exceeded the growth in ad revenues.
We expect ARPU to fluctuate based on the growth of our subscriber base, promotions, rebates offered to
subscribers and corresponding take-rates, plan mix, subscription prices, advertising sales and the identification of
additional revenue from subscribers.
SAC, As Adjusted, Per Gross Subscriber Addition. SAC, as adjusted, per gross subscriber addition was $59
and $87 for the three months ended December 31, 2008 and 2007, respectively. The decrease was primarily driven
by lower retail and OEM subsidies due to better product economics, the effect of purchase price accounting
adjustments and improved equipment margins.
We expect SAC, as adjusted, per gross subscriber addition to decline as the costs of subsidized components of
SIRIUS and XM radios decrease in the future. Our SAC, as adjusted, per gross subscriber addition will continue to
be impacted by our increasing mix of OEM gross subscriber additions.
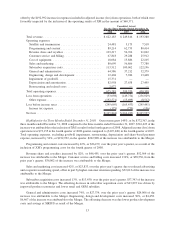
Customer Service and Billing Expenses, As Adjusted, Per Average Subscriber. Customer service and billing
expenses, as adjusted, per average subscriber declined 4% to $1.18 for the three months ended December 31, 2008
compared with $1.23 for the three months ended December 31, 2007. The decline was primarily due to efficiencies
across a larger subscriber base.
We expect customer service and billing expenses, as adjusted, per average subscriber to decrease on an annual basis
as our subscriber base grows due to scale efficiencies in our call centers and other customer care and billing operations.
Adjusted Income (Loss) from Operations. Our adjusted income (loss) from operations for the three months
ended December 31, 2008 was $72,155 compared to ($107,220) for the three months ended December 31, 2007.
Adjusted income (loss) from operations was favorably impacted by the $372,367 increase in revenues, partially
12