United Healthcare 2007 Annual Report Download - page 35
Download and view the complete annual report
Please find page 35 of the 2007 United Healthcare annual report below. You can navigate through the pages in the report by either clicking on the pages listed below, or by using the keyword search tool below to find specific information within the annual report.-
 1
1 -
2
-
3
-
4
-
5
-
6
-
7
-
8
-
9
-
10
-
11
-
12
-
13
-
14
-
15
-
16
-
17
-
18
-
19
-
20
-
21
-
22
-
23
-
24
-
 25
25 -
 26
26 -
 27
27 -
 28
28 -
 29
29 -
 30
30 -
 31
31 -
 32
32 -
 33
33 -
 34
34 -
 35
35 -
 36
36 -
 37
37 -
 38
38 -
 39
39 -
 40
40 -
 41
41 -
 42
42 -
 43
43 -
 44
44 -
 45
45 -
46
-
47
-
48
-
49
-
50
-
51
-
52
-
53
-
54
-
55
-
56
-
57
-
58
-
59
-
60
-
61
-
62
-
63
-
64
-
65
-
66
-
67
-
68
-
69
-
70
-
71
-
72
-
73
-
74
-
75
-
76
-
77
-
78
-
79
-
80
-
81
-
82
-
83
-
84
-
85
-
86
-
87
-
88
-
89
-
90
-
91
-
92
-
93
-
94
-
95
-
96
-
97
-
98
-
99
-
100
-
101
-
102
-
103
-
104
-
105
-
106
 |
 |
notional amounts of $5.6 billion as of December 31, 2007, with variable rates that are benchmarked to the
LIBOR. As of December 31, 2007, the aggregate asset, recorded at fair value, for all existing interest rate swaps
was approximately $151 million. These interest rate swap agreements qualify as fair value hedges and are
accounted for using the short-cut method under Statement of Financial Accounting Standards No. 133,
“Accounting for Derivative Instruments and Hedging Activities” (FAS 133), whereby the hedges are reported in
our Consolidated Balance Sheets at fair value, and the carrying value of the long-term debt is adjusted for an
offsetting amount representing changes in fair value attributable to the hedged risk. Since these amounts
completely offset, we have reported both the swap asset and the debt liability within debt in our Consolidated
Balance Sheets and there have been no net gains or losses recognized in our Consolidated Statements of
Operations. At December 31, 2007, the rates used to accrue interest expense on these agreements ranged from
4.1% to 6.1%.
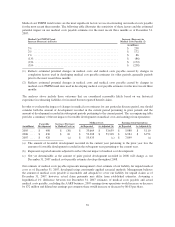
Stock Repurchases. Under our Board of Directors’ authorization, we maintain a common stock repurchase
program. Repurchases may be made from time to time at prevailing prices, subject to certain restrictions on
volume, pricing and timing. During 2007, we repurchased 125.3 million shares which were settled for cash on or
before December 31, 2007 at an average price of approximately $53 per share and an aggregate cost of
approximately $6.6 billion. During 2006, we repurchased 40.2 million shares which were settled for cash on or
before December 31, 2006 at an average price of approximately $56 per share and an aggregate cost of
approximately $2.2 billion. As of December 31, 2007, we had Board of Directors’ authorization to purchase up to
an additional 171.9 million shares of our common stock. Our common stock repurchase program is discretionary
as we are under no obligation to repurchase shares. We expect to repurchase approximately $5 billion of our
common stock in 2008.
Capital Resources
As of December 31, 2007 and 2006, we had commercial paper and debt outstanding of approximately $11.0
billion and $7.5 billion, respectively. Our debt-to-total-capital ratio was 35.4% and 26.4% as of December 31,
2007 and 2006, respectively. Commercial paper consisted of senior unsecured debt sold on a discounted basis
with maturities up to 270 days.
The availability of financing in the form of debt or equity is influenced by many factors, including our
profitability, operating cash flows, debt levels, debt ratings, debt covenants and other contractual restrictions,
regulatory requirements and market conditions. We believe that our strategies and actions toward maintaining
financial flexibility mitigate much of this risk. However, a significant downgrade in ratings may increase the cost
of borrowing for us or limit our access to capital. See “— Cautionary Statements” for additional information.
Cash and Investments. We maintained a strong liquidity position, with cash and investments of $22.3 billion and
$20.6 billion at December 31, 2007 and 2006, respectively. Total cash and investments increased by $1.7 billion
since December 31, 2006, primarily due to strong operating cash flows, the issuance of debt, and proceeds
received from common stock issuances related to exercises of share-based awards, partially offset by common
stock repurchases, repayments of debt, capital expenditures, and funds paid to Centers for Medicare & Medicaid
Services (CMS) under the Medicare Part D program.
As further described under “— Dividend Restrictions,” many of our subsidiaries are subject to various
government regulations that restrict the timing and amount of dividends and other distributions that may be paid
to their parent companies. At December 31, 2007, approximately $2.4 billion of our $22.3 billion of cash and
investments was held by non-regulated subsidiaries and was available for general corporate use, including
acquisitions and common stock repurchases.
Shelf Registration. In February 2008, we filed a universal S-3 shelf registration statement with the SEC
registering an unlimited amount of debt securities.
33