United Healthcare 2007 Annual Report Download - page 25
Download and view the complete annual report
Please find page 25 of the 2007 United Healthcare annual report below. You can navigate through the pages in the report by either clicking on the pages listed below, or by using the keyword search tool below to find specific information within the annual report.-
 1
1 -
2
-
3
-
4
-
5
-
6
-
7
-
8
-
9
-
10
-
11
-
12
-
13
-
14
-
 15
15 -
 16
16 -
 17
17 -
 18
18 -
 19
19 -
 20
20 -
 21
21 -
 22
22 -
 23
23 -
 24
24 -
 25
25 -
 26
26 -
 27
27 -
 28
28 -
 29
29 -
 30
30 -
 31
31 -
 32
32 -
 33
33 -
 34
34 -
 35
35 -
36
-
37
-
38
-
39
-
40
-
41
-
42
-
43
-
44
-
45
-
46
-
47
-
48
-
49
-
50
-
51
-
52
-
53
-
54
-
55
-
56
-
57
-
58
-
59
-
60
-
61
-
62
-
63
-
64
-
65
-
66
-
67
-
68
-
69
-
70
-
71
-
72
-
73
-
74
-
75
-
76
-
77
-
78
-
79
-
80
-
81
-
82
-
83
-
84
-
85
-
86
-
87
-
88
-
89
-
90
-
91
-
92
-
93
-
94
-
95
-
96
-
97
-
98
-
99
-
100
-
101
-
102
-
103
-
104
-
105
-
106
 |
 |

Cost of Products Sold
Cost of products sold in 2007 totaled $768 million, an increase of $169 million, or 28%, over 2006. This was
primarily due to costs associated with increased pharmacy sales at Prescription Solutions as a result of providing
prescription drug benefit services to an additional four million Ovations Medicare Advantage and Part D
members in 2007.
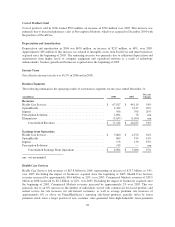
Depreciation and Amortization
Depreciation and amortization in 2007 was $796 million, an increase of $126 million, or 19%, over 2006. This
increase was primarily related to higher levels of computer equipment and capitalized software as a result of
technology enhancements, business growth and businesses acquired since the beginning of 2006, as well as
separately identifiable intangible assets acquired in business acquisitions since the beginning of 2006.
Income Taxes
Our effective income tax rate was 36.3% in both 2007 and 2006.
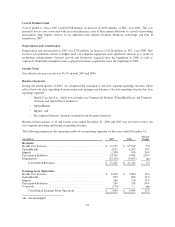
Business Segments
During the fourth quarter of 2007, we completed the transition to our new segment reporting structure which
reflects how our chief operating decision maker now manages our business. Our new reporting structure has four
reporting segments:
• Health Care Services, which now includes our Commercial Markets (UnitedHealthcare and Uniprise),
Ovations and AmeriChoice businesses;
• OptumHealth;
• Ingenix; and
• Prescription Solutions (formerly included in the Ovations business).
Historical financial data as of and for the years ended December 31, 2006 and 2005 was revised to reflect our
new segment operating and financial reporting structure.
The following summarizes the operating results of our reporting segments for the years ended December 31:
(in millions) 2007 2006
Percent
Change
Revenues
Health Care Services ....................................... $ 71,199 $ 67,817 5%
OptumHealth ............................................. 4,921 4,342 13%
Ingenix .................................................. 1,304 956 36%
Prescription Solutions ...................................... 13,249 4,084 224%
Eliminations ............................................. (15,242) (5,657) nm
Consolidated Revenues ................................. $ 75,431 $ 71,542 5%
Earnings from Operations
Health Care Services ....................................... $ 6,595 $ 5,860 13%
OptumHealth ............................................. 895 809 11%
Ingenix .................................................. 266 176 51%
Prescription Solutions ...................................... 269 139 94%
Corporate ................................................ (176) — nm
Consolidated Earnings From Operations ................... $ 7,849 $ 6,984 12%
nm - not meaningful
23