United Healthcare 2007 Annual Report Download - page 24
Download and view the complete annual report
Please find page 24 of the 2007 United Healthcare annual report below. You can navigate through the pages in the report by either clicking on the pages listed below, or by using the keyword search tool below to find specific information within the annual report.-
 1
1 -
2
-
3
-
4
-
5
-
6
-
7
-
8
-
9
-
10
-
11
-
12
-
13
-
 14
14 -
 15
15 -
 16
16 -
 17
17 -
 18
18 -
 19
19 -
 20
20 -
 21
21 -
 22
22 -
 23
23 -
 24
24 -
 25
25 -
 26
26 -
 27
27 -
 28
28 -
 29
29 -
 30
30 -
 31
31 -
 32
32 -
 33
33 -
 34
34 -
35
-
36
-
37
-
38
-
39
-
40
-
41
-
42
-
43
-
44
-
45
-
46
-
47
-
48
-
49
-
50
-
51
-
52
-
53
-
54
-
55
-
56
-
57
-
58
-
59
-
60
-
61
-
62
-
63
-
64
-
65
-
66
-
67
-
68
-
69
-
70
-
71
-
72
-
73
-
74
-
75
-
76
-
77
-
78
-
79
-
80
-
81
-
82
-
83
-
84
-
85
-
86
-
87
-
88
-
89
-
90
-
91
-
92
-
93
-
94
-
95
-
96
-
97
-
98
-
99
-
100
-
101
-
102
-
103
-
104
-
105
-
106
 |
 |
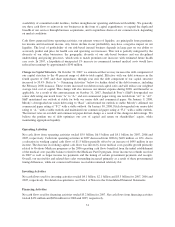
For each period, our operating results include the effects of revisions in medical cost estimates related to all prior
periods. Changes in medical cost estimates related to prior fiscal years, resulting from more complete claim
information and other facts and circumstances, that are identified in the current year are included in total medical
costs reported for the current fiscal year. Medical costs for 2007 included approximately $420 million of
favorable medical cost development related to prior fiscal years. Medical costs for 2006 included approximately
$430 million of favorable medical cost development related to prior fiscal years.
Medical costs for 2007 increased $2.1 billion, or 4%, to $55.4 billion, primarily due to an annual medical cost
trend of 7% to 8% on commercial risk-based business due to medical cost inflation and increased utilization, as
well as growth in Ovations Medicare programs, partially offset by a decrease in the number of individuals served
by commercial risk-based products.
Operating Costs
The operating cost ratio (operating costs as a percentage of total revenues) for 2007 of 14.0% was consistent with
2006. The operating cost ratio reflected productivity gains from technology deployment and other cost
management initiatives, offset by the effect of business mix change as fee-based businesses such as Ingenix
increase in size and impact, as well as increased investment in technology, service and product enhancements;
incremental marketing and advertising costs for Medicare Advantage products; and expenses in the first quarter
of 2007 associated with the application of deferred compensation rules under Section 409A of the Internal
Revenue Code (Section 409A) to our historical stock option practices, as described below.
Operating costs in 2007 totaled $10.6 billion, an increase of $602 million, or 6%, over 2006. This increase was
primarily due to general operating cost inflation and was also impacted by the items discussed above.
Included in the operating costs for 2007 is $176 million ($112 million net of tax benefit) of expenses recorded in
the first quarter of 2007 related to application of deferred compensation rules under Section 409A to our
historical stock option practices. As part of our review of the Company’s historical stock option practices, we
determined that certain stock options granted to individuals who were nonexecutive officer employees at the time
of grant were granted with an exercise price that was lower than the closing price of our common stock on the
applicable accounting measurement date, subjecting these individuals to additional tax under Section 409A. The
Company elected to pay these individuals for the additional tax costs relating to such stock options exercised in
2006 and early 2007. For any outstanding stock options subject to additional tax under Section 409A that were
granted to nonexecutive officer employees, the Company increased the exercise price and committed to make
cash payments to these optionholders for their vested options based on the difference between the original stock
option exercise price and the revised increased stock option exercise price. The payments will be made on a
quarterly basis upon vesting of the applicable awards. The first payment of $110 million was made to
optionholders in January 2008 for options vested through December 31, 2007. Aggregate future payments will be
$38 million, assuming all applicable options vest during 2008 and 2009. If the modified stock options are
subsequently exercised, the Company will recover these cash payments at that time from exercise proceeds at the
revised increased stock option exercise prices.
The $176 million Section 409A charge includes $87 million of expense ($55 million net of tax benefit) for the
payment of certain optionholders’ tax obligations for stock options exercised in 2006 and early 2007 and $89
million of expense ($57 million net of tax benefit) for the modification related to increasing the exercise price of
unexercised stock options granted to nonexecutive officer employees and the related cash payments. These
amounts have been recorded as corporate expenses and have not been allocated to individual business segments.
As previously disclosed, in December 2006, the Company entered into agreements with individuals who were
executive officers of the Company at the time of grant of an applicable stock option to increase the exercise price
of certain outstanding stock options. No compensation was payable to any of those individuals as a result of the
increase in the exercise price of their stock options.
22