United Healthcare 2005 Annual Report Download - page 61
Download and view the complete annual report
Please find page 61 of the 2005 United Healthcare annual report below. You can navigate through the pages in the report by either clicking on the pages listed below, or by using the keyword search tool below to find specific information within the annual report.-
 1
1 -
2
-
3
-
4
-
5
-
6
-
7
-
8
-
9
-
10
-
11
-
12
-
13
-
14
-
15
-
16
-
17
-
18
-
19
-
20
-
21
-
22
-
23
-
24
-
25
-
26
-
27
-
28
-
29
-
30
-
31
-
32
-
33
-
34
-
35
-
36
-
37
-
38
-
39
-
40
-
41
-
42
-
43
-
44
-
45
-
46
-
47
-
48
-
49
-
50
-
 51
51 -
 52
52 -
 53
53 -
 54
54 -
 55
55 -
 56
56 -
 57
57 -
 58
58 -
 59
59 -
 60
60 -
 61
61 -
 62
62 -
 63
63 -
 64
64 -
 65
65 -
 66
66 -
 67
67 -
 68
68 -
 69
69 -
 70
70 -
 71
71 -
72
-
73
-
74
-
75
-
76
-
77
-
78
-
79
-
80
-
81
-
82
-
83
 |
 |

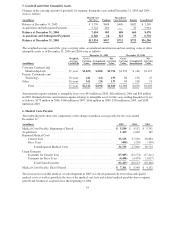
The components of deferred income tax assets and liabilities are as follows:
As of December 31, (in millions) 2005 2004
Deferred Income Tax Assets
Accrued Expenses and Allowances ............................................ $ 317 $ 227
Unearned Premiums ....................................................... 44 57
Medical Costs Payable and Other Policy Liabilities ............................... 208 85
Long Term Liabilities ...................................................... 87 78
Net Operating Loss Carryforwards ............................................ 110 123
Other ................................................................... 87 31
Subtotal ..................................................................... 853 601
Less: Valuation Allowances ................................................. (28) (28)
Total Deferred Income Tax Assets ................................................ 825 573
Deferred Income Tax Liabilities
Capitalized Software Development ............................................ (270) (223)
Net Unrealized Gains on Investments .......................................... (19) (72)
Intangible Assets .......................................................... (776) (406)
Property and Equipment .................................................... (5) (63)
Other ................................................................... —(16)
Total Deferred Income Tax Liabilities ............................................. (1,070) (780)
Net Deferred Income Tax Assets (Liabilities) ................................ $ (245) $(207)
Valuation allowances are provided when it is considered more likely than not that deferred tax assets will not be
realized. The valuation allowances primarily relate to future tax benefits on certain federal and state net operating
loss carryforwards. Federal net operating loss carryforwards expire beginning in 2018 through 2024, and state net
operating loss carryforwards expire beginning in 2006 through 2025.
We made cash payments for income taxes of $1,377 million in 2005, $898 million in 2004 and $783 million in
2003. We recorded a tax benefit upon the exercise of non-qualified stock options of $320 million in 2005,
$358 million in 2004, and $222 million in 2003.
Consolidated income tax returns for fiscal years 2003 and 2004 are currently being examined by the Internal
Revenue Service. We do not believe any adjustments that may result from the examination will have a significant
impact on our consolidated financial statement position or results of operations.
11. AARP
In January 1998, we entered into a 10-year contract to provide health insurance products and services to members
of AARP. These products and services are provided to supplement benefits covered under traditional Medicare.
Under the terms of the contract, we are compensated for transaction processing and other services as well as for
assuming underwriting risk. We are also engaged in product development activities to complement the insurance
offerings under this program. Premium revenues from our portion of the AARP insurance offerings were
approximately $4.9 billion in 2005, $4.5 billion in 2004 and $4.1 billion in 2003.
The underwriting gains or losses related to the AARP business are directly recorded as an increase or decrease to
a rate stabilization fund (RSF). The primary components of the underwriting results are premium revenue,
medical costs, investment income, administrative expenses, member service expenses, marketing expenses and
premium taxes. Underwriting gains and losses are recorded as an increase or decrease to the RSF and accrue to
the overall benefit of the AARP policyholders, unless cumulative net losses were to exceed the balance in the
RSF. To the extent underwriting losses exceed the balance in the RSF, we would have to fund the deficit. Any
59