United Healthcare 2005 Annual Report Download - page 26
Download and view the complete annual report
Please find page 26 of the 2005 United Healthcare annual report below. You can navigate through the pages in the report by either clicking on the pages listed below, or by using the keyword search tool below to find specific information within the annual report.-
 1
1 -
2
-
3
-
4
-
5
-
6
-
7
-
8
-
9
-
10
-
11
-
12
-
13
-
14
-
15
-
 16
16 -
 17
17 -
 18
18 -
 19
19 -
 20
20 -
 21
21 -
 22
22 -
 23
23 -
 24
24 -
 25
25 -
 26
26 -
 27
27 -
 28
28 -
 29
29 -
 30
30 -
 31
31 -
 32
32 -
 33
33 -
 34
34 -
 35
35 -
 36
36 -
37
-
38
-
39
-
40
-
41
-
42
-
43
-
44
-
45
-
46
-
47
-
48
-
49
-
50
-
51
-
52
-
53
-
54
-
55
-
56
-
57
-
58
-
59
-
60
-
61
-
62
-
63
-
64
-
65
-
66
-
67
-
68
-
69
-
70
-
71
-
72
-
73
-
74
-
75
-
76
-
77
-
78
-
79
-
80
-
81
-
82
-
83
 |
 |
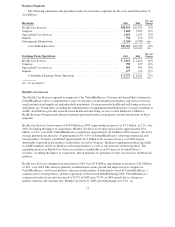
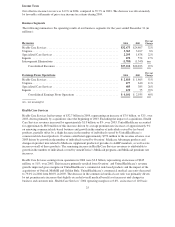
Service Revenues Service revenues in 2004 totaled $3.3 billion, an increase of $217 million, or 7%, over 2003.
The increase in service revenues was driven primarily by aggregate growth of 4% in the number of individuals
served by Uniprise and UnitedHealthcare under fee-based arrangements during 2004, excluding the impact of
acquisitions, as well as annual rate increases. In addition, Ingenix service revenues increased due to new business
growth in the health information and clinical research businesses.
Investment and Other Income Investment and other income totaled $388 million, representing an increase of
$131 million over 2003. Interest income increased by $134 million in 2004, principally due to the impact of
increased levels of cash and fixed-income investments during the year from the acquisitions of Oxford, MAMSI
and Golden Rule Financial Corporation (Golden Rule), which was acquired in November 2003. Net capital gains
on sales of investments were $19 million in 2004, a decrease of $3 million from 2003.
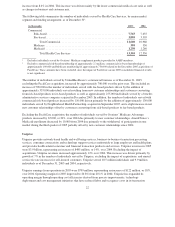
Medical Costs
The consolidated medical care ratio decreased from 81.4% in 2003 to 80.6% in 2004. Excluding the AARP
business, the medical care ratio decreased from 80.0% in 2003 to 79.5% in 2004. The medical care ratio decrease
resulted primarily from net premium rate increases that slightly exceeded overall medical benefit cost increases
and changes in product, business and customer mix.
Each period, our operating results include the effects of revisions in medical cost estimates related to all prior
periods. Changes in medical cost estimates related to prior fiscal years that are identified in the current year are
included in total medical costs reported for the current fiscal year. Medical costs for 2004 include approximately
$210 million of favorable medical cost development related to prior fiscal years. Medical costs for 2003 include
approximately $150 million of favorable medical cost development related to prior fiscal years.
On an absolute dollar basis, 2004 medical costs increased $6.3 billion, or 30%, over 2003 principally due to the
impact of the acquisitions of Oxford, MAMSI and Golden Rule. Excluding the impact of acquisitions, medical
costs increased by approximately 8% driven primarily by medical cost inflation and a moderate increase in health
care consumption.
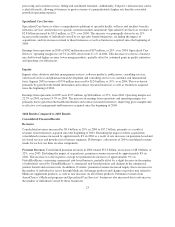
Operating Costs
The operating cost ratio for 2004 was 15.4%, down from 16.9% in 2003. This decrease was driven by revenue
mix changes, with premium revenues growing at a faster rate than service revenues largely due to recent
acquisitions. The existence of premium revenues within our risk-based products cause them to have lower
operating cost ratios than fee-based products, which have no premium revenues. Additionally, the decrease in the
operating cost ratio reflects productivity gains from technology deployment and other cost management
initiatives.
On an absolute dollar basis, operating costs for 2004 increased $868 million, or 18%, over 2003 primarily due to
the acquisitions of Oxford, MAMSI and Golden Rule. Excluding the impact of acquisitions, operating costs
increased by approximately 3%. This increase was driven by a more than 3% increase in the total number of
individuals served by Health Care Services and Uniprise in 2004, excluding the impact of acquisitions, and
general operating cost inflation, partially offset by productivity gains from technology deployment and other cost
management initiatives.
Depreciation and Amortization
Depreciation and amortization in 2004 was $374 million, an increase of $75 million, or 25%, over 2003.
Approximately $42 million of this increase is related to intangible assets acquired in business acquisitions in
2004. The remaining increase is due primarily to additional depreciation and amortization from higher levels of
computer equipment and capitalized software as a result of technology enhancements, business growth and
businesses acquired since the beginning of 2003.
24