United Healthcare 2005 Annual Report Download - page 47
Download and view the complete annual report
Please find page 47 of the 2005 United Healthcare annual report below. You can navigate through the pages in the report by either clicking on the pages listed below, or by using the keyword search tool below to find specific information within the annual report.-
 1
1 -
2
-
3
-
4
-
5
-
6
-
7
-
8
-
9
-
10
-
11
-
12
-
13
-
14
-
15
-
16
-
17
-
18
-
19
-
20
-
21
-
22
-
23
-
24
-
25
-
26
-
27
-
28
-
29
-
30
-
31
-
32
-
33
-
34
-
35
-
36
-
 37
37 -
 38
38 -
 39
39 -
 40
40 -
 41
41 -
 42
42 -
 43
43 -
 44
44 -
 45
45 -
 46
46 -
 47
47 -
 48
48 -
 49
49 -
 50
50 -
 51
51 -
 52
52 -
 53
53 -
 54
54 -
 55
55 -
 56
56 -
 57
57 -
58
-
59
-
60
-
61
-
62
-
63
-
64
-
65
-
66
-
67
-
68
-
69
-
70
-
71
-
72
-
73
-
74
-
75
-
76
-
77
-
78
-
79
-
80
-
81
-
82
-
83
 |
 |

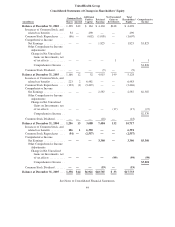
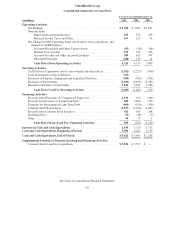
UnitedHealth Group
Consolidated Statements of Cash Flows
For the Year Ended December 31,
(in millions) 2005 2004 2003
Operating Activities
NetEarnings ................................................... $ 3,300 $ 2,587 $ 1,825
Noncash Items
Depreciation and Amortization ................................ 453 374 299
Deferred Income Taxes and Other .............................. 167 125 91
Net Change in Other Operating Items, net of effects from acquisitions, and
changes in AARP balances:
Accounts Receivable and Other Current Assets .................... (83) (30) (46)
Medical Costs Payable ....................................... 193 322 276
Accounts Payable and Other Accrued Liabilities ................... 580 623 547
Unearned Premiums ......................................... (284) 134 11
Cash Flows From Operating Activities ........................ 4,326 4,135 3,003
Investing Activities
Cash Paid for Acquisitions, net of cash assumed and other effects ......... (2,562) (2,225) (590)
Cash Transferred on Sale of Business ............................... (363) ——
Purchases of Property, Equipment and Capitalized Software ............. (509) (350) (352)
Purchases of Investments ......................................... (5,876) (3,190) (2,583)
Maturities and Sales of Investments ................................. 5,821 4,121 2,780
Cash Flows Used For Investing Activities ...................... (3,489) (1,644) (745)
Financing Activities
Proceeds from (Payments of) Commercial Paper, net ................... 2,556 194 (382)
Proceeds from Issuance of Long-Term Debt .......................... 500 2,000 950
Payments for Retirement of Long-Term Debt ......................... (400) (150) (350)
Common Stock Repurchases ...................................... (2,557) (3,446) (1,607)
Proceeds from Common Stock Issuances ............................. 423 583 268
DividendsPaid ................................................. (19) (18) (9)
Other ......................................................... 90 75 4
Cash Flows From (Used For) Financing Activities ............... 593 (762) (1,126)
Increase in Cash and Cash Equivalents ................................ 1,430 1,729 1,132
Cash and Cash Equivalents, Beginning of Period ........................ 3,991 2,262 1,130
Cash and Cash Equivalents, End of Period ............................. $ 5,421 $ 3,991 $ 2,262
Supplemental Schedule of Noncash Investing and Financing Activities
Common Stock Issued for Acquisitions .............................. $ 5,696 $ 5,557 $ —
See Notes to Consolidated Financial Statements.
45