United Healthcare 2005 Annual Report Download - page 56
Download and view the complete annual report
Please find page 56 of the 2005 United Healthcare annual report below. You can navigate through the pages in the report by either clicking on the pages listed below, or by using the keyword search tool below to find specific information within the annual report.-
 1
1 -
2
-
3
-
4
-
5
-
6
-
7
-
8
-
9
-
10
-
11
-
12
-
13
-
14
-
15
-
16
-
17
-
18
-
19
-
20
-
21
-
22
-
23
-
24
-
25
-
26
-
27
-
28
-
29
-
30
-
31
-
32
-
33
-
34
-
35
-
36
-
37
-
38
-
39
-
40
-
41
-
42
-
43
-
44
-
45
-
 46
46 -
 47
47 -
 48
48 -
 49
49 -
 50
50 -
 51
51 -
 52
52 -
 53
53 -
 54
54 -
 55
55 -
 56
56 -
 57
57 -
 58
58 -
 59
59 -
 60
60 -
 61
61 -
 62
62 -
 63
63 -
 64
64 -
 65
65 -
 66
66 -
67
-
68
-
69
-
70
-
71
-
72
-
73
-
74
-
75
-
76
-
77
-
78
-
79
-
80
-
81
-
82
-
83
 |
 |

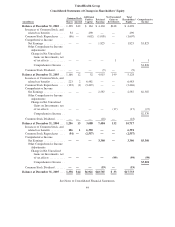
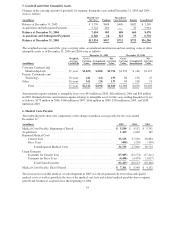
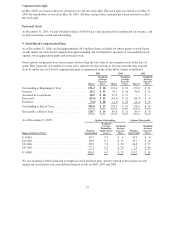
5. Goodwill and Other Intangible Assets
Changes in the carrying amount of goodwill, by segment, during the years ended December 31, 2005 and 2004,
were as follows:
(in millions)
Health Care
Services Uniprise
Specialized
Care Services Ingenix Consolidated
Balance at December 31, 2003 .................. $ 1,770 $698 $409 $632 $ 3,509
Acquisitions and Subsequent Payments ........... 5,724 205 — 32 5,961
Balance at December 31, 2004 ................. 7,494 903 409 664 9,470
Acquisitions and Subsequent Payments ......... 6,340 14 323 59 6,736
Balance at December 31, 2005 ................. $13,834 $917 $732 $723 $16,206
The weighted-average useful life, gross carrying value, accumulated amortization and net carrying value of other
intangible assets as of December 31, 2005 and 2004 were as follows:
December 31, 2005 December 31, 2004
(in millions)
Weighted-
Average
Useful Life
Gross
Carrying
Value
Accumulated
Amortization
Net
Carrying
Value
Gross
Carrying
Value
Accumulated
Amortization
Net
Carrying
Value
Customer Contracts and
Membership Lists ............. 15years $1,830 $(106) $1,724 $1,153 $ (46) $1,107
Patents, Trademarks and
Technology .................. 10years 221 (62) 159 86 (39) 47
Other ......................... 16years 161 (24) 137 69 (18) 51
Total ..................... 15years $2,212 $(192) $2,020 $1,308 $(103) $1,205
Amortization expense relating to intangible assets was $94 million in 2005, $62 million in 2004 and $18 million
in 2003. Estimated future amortization expense relating to intangible assets for the years ending December 31 are
as follows: $175 million in 2006, $168 million in 2007, $164 million in 2008, $156 million in 2009, and $148
million in 2010.
6. Medical Costs Payable
The following table shows the components of the change in medical costs payable for the years ended
December 31:
(in millions) 2005 2004 2003
Medical Costs Payable, Beginning of Period ............................ $ 5,540 $ 4,152 $ 3,741
Acquisitions ..................................................... 1,469 1,040 165
Reported Medical Costs
Current Year ................................................. 33,125 27,210 20,864
Prior Years .................................................. (400) (210) (150)
Total Reported Medical Costs ............................... 32,725 27,000 20,714
Claim Payments
Payments for Current Year ...................................... (27,985) (23,173) (17,411)
Payments for Prior Years ....................................... (4,448) (3,479) (3,057)
Total Claim Payments ..................................... (32,433) (26,652) (20,468)
Medical Costs Payable, End of Period ................................. $ 7,301 $ 5,540 $ 4,152
The increase in favorable medical cost development in 2005 was driven primarily by lower than anticipated
medical costs as well as growth in the size of the medical cost base and related medical payables due to organic
growth and businesses acquired since the beginning of 2004.
54