United Healthcare 2005 Annual Report Download - page 28
Download and view the complete annual report
Please find page 28 of the 2005 United Healthcare annual report below. You can navigate through the pages in the report by either clicking on the pages listed below, or by using the keyword search tool below to find specific information within the annual report.-
 1
1 -
2
-
3
-
4
-
5
-
6
-
7
-
8
-
9
-
10
-
11
-
12
-
13
-
14
-
15
-
16
-
17
-
 18
18 -
 19
19 -
 20
20 -
 21
21 -
 22
22 -
 23
23 -
 24
24 -
 25
25 -
 26
26 -
 27
27 -
 28
28 -
 29
29 -
 30
30 -
 31
31 -
 32
32 -
 33
33 -
 34
34 -
 35
35 -
 36
36 -
 37
37 -
 38
38 -
39
-
40
-
41
-
42
-
43
-
44
-
45
-
46
-
47
-
48
-
49
-
50
-
51
-
52
-
53
-
54
-
55
-
56
-
57
-
58
-
59
-
60
-
61
-
62
-
63
-
64
-
65
-
66
-
67
-
68
-
69
-
70
-
71
-
72
-
73
-
74
-
75
-
76
-
77
-
78
-
79
-
80
-
81
-
82
-
83
 |
 |

points over 2003. This increase was principally driven by a combination of the improved commercial medical
care ratio and changes in business and customer mix.
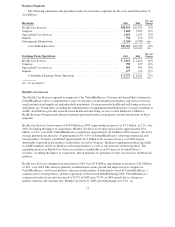
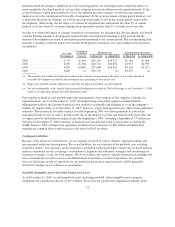
The following table summarizes the number of individuals served by Health Care Services, by major market
segment and funding arrangement, as of December 311:
(in thousands) 2004 2003
Commercial
Risk-based ...................................................... 7,655 5,400
Fee-based ....................................................... 3,305 2,895
Total Commercial ............................................ 10,960 8,295
Medicare ....................................................... 330 230
Medicaid ....................................................... 1,260 1,105
Total Health Care Services ..................................... 12,550 9,630
1Excludes individuals served by Ovations’ Medicare supplement products provided to AARP members.
The number of individuals served by UnitedHealthcare’s commercial business as of December 31, 2004,
increased by nearly 2.7 million, or 32%, over the prior year. Excluding the 2004 acquisitions of Oxford, MAMSI
and a smaller regional health plan, the number of individuals served by UnitedHealthcare’s commercial business
increased by 245,000. This included an increase of 285,000 in the number of individuals served with fee-based
products, driven by new customer relationships and existing customers converting from risk-based products to
fee-based products, partially offset by a decrease of 40,000 in the number of individuals served with risk-based
products resulting primarily from customers converting to self-funded, fee-based arrangements and a competitive
commercial risk-based pricing environment.
Excluding the impact of the Oxford acquisition, the number of individuals served by Ovations’ Medicare
Advantage products increased by 30,000, or 13%, from 2003. AmeriChoice’s Medicaid enrollment increased by
155,000, or 14%, due to organic growth in the number of individuals served and the acquisition of a Medicaid
health plan in Michigan in February 2004, resulting in the addition of approximately 95,000 individuals served.
Uniprise
Uniprise revenues in 2004 were $3.4 billion, representing an increase of 8% over 2003. This increase was driven
primarily by growth of 4% in the number of individuals served by Uniprise, excluding the impact of acquisitions,
and annual service fee rate increases for self-insured customers. Uniprise served 9.9 million individuals and
9.1 million individuals as of December 31, 2004 and 2003, respectively.
Uniprise earnings from operations in 2004 were $677 million, representing an increase of 11% over 2003.
Operating margin for 2004 improved to 20.1% from 19.6% in 2003. Uniprise has expanded its operating margin
through operating cost efficiencies derived from process improvements, technology deployment and cost
management initiatives that have reduced labor and occupancy costs in its transaction processing and customer
service, billing and enrollment functions.
Specialized Care Services
Specialized Care Services revenues during 2004 of $2.3 billion increased by $417 million, or 22%, over 2003.
This increase was principally driven by an increase in the number of individuals served by its behavioral health
benefits business, its dental services business and its vision care benefits business; rate increases related to these
businesses; and incremental revenues related to businesses acquired since the beginning of 2003 of
approximately $100 million.
26