United Healthcare 2005 Annual Report Download - page 25
Download and view the complete annual report
Please find page 25 of the 2005 United Healthcare annual report below. You can navigate through the pages in the report by either clicking on the pages listed below, or by using the keyword search tool below to find specific information within the annual report.-
 1
1 -
2
-
3
-
4
-
5
-
6
-
7
-
8
-
9
-
10
-
11
-
12
-
13
-
14
-
 15
15 -
 16
16 -
 17
17 -
 18
18 -
 19
19 -
 20
20 -
 21
21 -
 22
22 -
 23
23 -
 24
24 -
 25
25 -
 26
26 -
 27
27 -
 28
28 -
 29
29 -
 30
30 -
 31
31 -
 32
32 -
 33
33 -
 34
34 -
 35
35 -
36
-
37
-
38
-
39
-
40
-
41
-
42
-
43
-
44
-
45
-
46
-
47
-
48
-
49
-
50
-
51
-
52
-
53
-
54
-
55
-
56
-
57
-
58
-
59
-
60
-
61
-
62
-
63
-
64
-
65
-
66
-
67
-
68
-
69
-
70
-
71
-
72
-
73
-
74
-
75
-
76
-
77
-
78
-
79
-
80
-
81
-
82
-
83
 |
 |
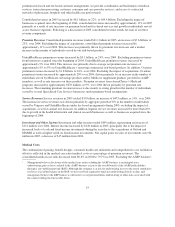
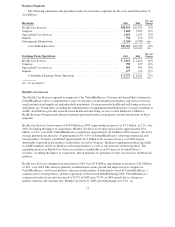
processing and customer service, billing and enrollment functions. Additionally, Uniprise’s infrastructure can be
scaled efficiently, allowing its business to grow revenues at a proportionately higher rate than the associated
growth in operating expenses.
Specialized Care Services
Specialized Care Services offers a comprehensive platform of specialty health, wellness and ancillary benefits,
networks, services and resources to specific customer markets nationwide. Specialized Care Services revenues of
$2.8 billion increased by $511 million, or 22%, over 2004. This increase was principally driven by an 11%
increase in the number of individuals served by its specialty benefit businesses, excluding the impact of
acquisitions, and rate increases related to these businesses as well as businesses acquired since the beginning of
2004.
Earnings from operations in 2005 of $582 million increased $97 million, or 20%, over 2004. Specialized Care
Services’ operating margin was 20.7% in 2005, down from 21.1% in 2004. This decrease was due to a business
mix shift toward higher revenue, lower margin products, partially offset by continued gains in quality initiatives
and operating cost efficiencies.
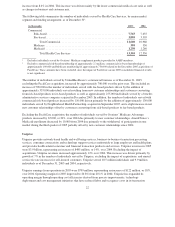
Ingenix
Ingenix offers database and data management services, software products, publications, consulting services,
outsourced services and pharmaceutical development and consulting services on a national and international
basis. Ingenix 2005 revenues of $794 million increased by $124 million, or 19%, over 2004. This was driven
primarily by growth in the health information and contract research businesses as well as businesses acquired
since the beginning of 2004.
Earnings from operations in 2005 were $177 million, up $48 million, or 37%, from 2004. Operating margin was
22.3% in 2005, up from 19.3% in 2004. The increase in earnings from operations and operating margin was
primarily due to growth in the health information and contract research businesses, improving gross margins due
to effective cost management and businesses acquired since the beginning of 2004.
2004 Results Compared to 2003 Results
Consolidated Financial Results
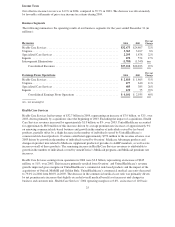
Revenues
Consolidated revenues increased by $8.4 billion, or 29%, in 2004 to $37.2 billion, primarily as a result of
revenues from businesses acquired since the beginning of 2003. Excluding the impact of these acquisitions,
consolidated revenues increased by approximately 8% in 2004 as a result of rate increases on premium-based and
fee-based services and growth across business segments. Following is a discussion of 2004 consolidated revenue
trends for each of our three revenue components.
Premium Revenues Consolidated premium revenues in 2004 totaled $33.5 billion, an increase of $8.0 billion, or
32%, over 2003. Excluding the impact of acquisitions, premium revenues increased by approximately 8% in
2004. This increase was due in part to average net premium rate increases of approximately 9% on
UnitedHealthcare’s renewing commercial risk-based business, partially offset by a slight decrease in the number
of individuals served by UnitedHealthcare’s commercial risk-based products and changes in the commercial
product benefit and customer mix. In addition, Ovations’ premium revenues increased largely due to increases in
the number of individuals it serves through Medicare Advantage products and changes in product mix related to
Medicare supplement products, as well as rate increases on all of these products. Premium revenues from
AmeriChoice’s Medicaid programs and Specialized Care Services’ businesses also increased due to advances in
the number of individuals served by those businesses.
23