Under Armour 2008 Annual Report Download - page 78
Download and view the complete annual report
Please find page 78 of the 2008 Under Armour annual report below. You can navigate through the pages in the report by either clicking on the pages listed below, or by using the keyword search tool below to find specific information within the annual report.-
 1
1 -
2
-
3
-
4
-
5
-
6
-
7
-
8
-
9
-
10
-
11
-
12
-
13
-
14
-
15
-
16
-
17
-
18
-
19
-
20
-
21
-
22
-
23
-
24
-
25
-
26
-
27
-
28
-
29
-
30
-
31
-
32
-
33
-
34
-
35
-
36
-
37
-
38
-
39
-
40
-
41
-
42
-
43
-
44
-
45
-
46
-
47
-
48
-
49
-
50
-
51
-
52
-
53
-
54
-
55
-
56
-
57
-
58
-
59
-
60
-
61
-
62
-
63
-
64
-
65
-
66
-
67
-
 68
68 -
 69
69 -
 70
70 -
 71
71 -
 72
72 -
 73
73 -
 74
74 -
 75
75 -
 76
76 -
 77
77 -
 78
78 -
 79
79 -
 80
80 -
 81
81 -
 82
82 -
 83
83 -
 84
84 -
 85
85 -
 86
86 -
 87
87 -
 88
88 -
89
-
90
-
91
-
92
-
93
-
94
-
95
-
96
 |
 |

The receipt of the shares otherwise deliverable upon vesting of the restricted stock units automatically
defers into deferred stock units under the 2006 DSU Plan. Under the 2006 DSU Plan each deferred stock unit
represents the Company’s obligation to issue one share of the Company’s Class A Common Stock with the
shares delivered six months following the termination of the director’s service.
Stock Options
The weighted average fair value of a stock option granted for the years ended December 31, 2008, 2007 and
2006 was $19.48, $22.88 and $17.14, respectively. The fair value of each stock option granted is estimated on the
date of grant using the Black-Scholes option-pricing model with the following weighted average assumptions:
Year Ended December 31,
2008 2007 2006
Risk-free interest rate 2.9% - 4.4% 4.5% - 4.6% 4.6% - 5.0%
Average expected life in years 5.4 - 8.3 5.5 - 6.5 5.5 - 6.5
Expected volatility 44.0% - 47.7% 44.4% 44.6% - 46.1%
Expected dividend yield 0% 0% 0%
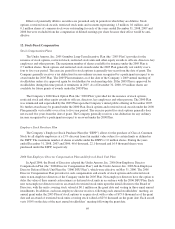
A summary of the Company’s stock options as of December 31, 2008, 2007 and 2006, and changes during
the years then ended is presented below:
Year Ended December 31,
(In thousands, except per share amounts) 2008 2007 2006
Number
of Stock
Options
Weighted
Average
Exercise
Price
Number
of Stock
Options
Weighted
Average
Exercise
Price
Number
of Stock
Options
Average
Exercise
Price
Outstanding, beginning of year 2,126 $ 8.23 2,755 $ 6.19 4,215 $ 3.42
Granted, at fair market value 609 37.96 67 45.12 197 36.17
Exercised (225) 3.49 (660) 3.34 (1,292) 2.29
Forfeited (54) 13.67 (36) 10.42 (365) 4.12
Outstanding, end of year 2,456 $15.92 2,126 $ 8.23 2,755 $ 6.19
Options exercisable, end of year 1,044 $ 7.22 639 $ 5.70 665 $ 2.39
The intrinsic value of stock options exercised during the years ended December 31, 2008, 2007 and 2006
was $6.7 million, $31.9 million and $43.5 million, respectively.
The following table summarizes information about stock options outstanding and exercisable as of
December 31, 2008:
(In thousands, except per share amounts)
Options Outstanding Options Exercisable
Range of
Exercise Prices
Number of
Underlying
Shares
Weighted
Average
Exercise
Price Per
Share
Weighted
Average
Remaining
Contractual
Life (Years)
Total
Intrinsic
Value
Number of
Underlying
Shares
Weighted
Average
Exercise
Price Per
Share
Weighted
Average
Remaining
Contractual
Life (Years)
Total
Intrinsic
Value
$0.17 233 $ 0.17 2.5 $ 5,517 233 $0.17 2.5 $ 5,517
$0.83 10 0.83 3.6 230 10 0.83 3.6 230
$1.77 – $2.65 941 2.25 2.1 20,302 460 2.23 2.3 9,938
$10.77 – $13.00 429 11.31 2.2 5,377 244 11.37 2.1 3,045
$25.99 – $38.84 414 32.01 8.6 — 69 35.47 7.2 —
$43.65 – $45.12 429 43.91 9.0 — 28 44.99 8.2 —
2,456 $15.92 4.4 $31,426 1,044 $7.22 2.8 $18,730
70