Under Armour 2008 Annual Report Download - page 43
Download and view the complete annual report
Please find page 43 of the 2008 Under Armour annual report below. You can navigate through the pages in the report by either clicking on the pages listed below, or by using the keyword search tool below to find specific information within the annual report.-
 1
1 -
2
-
3
-
4
-
5
-
6
-
7
-
8
-
9
-
10
-
11
-
12
-
13
-
14
-
15
-
16
-
17
-
18
-
19
-
20
-
21
-
22
-
23
-
24
-
25
-
26
-
27
-
28
-
29
-
30
-
31
-
32
-
 33
33 -
 34
34 -
 35
35 -
 36
36 -
 37
37 -
 38
38 -
 39
39 -
 40
40 -
 41
41 -
 42
42 -
 43
43 -
 44
44 -
 45
45 -
 46
46 -
 47
47 -
 48
48 -
 49
49 -
 50
50 -
 51
51 -
 52
52 -
 53
53 -
54
-
55
-
56
-
57
-
58
-
59
-
60
-
61
-
62
-
63
-
64
-
65
-
66
-
67
-
68
-
69
-
70
-
71
-
72
-
73
-
74
-
75
-
76
-
77
-
78
-
79
-
80
-
81
-
82
-
83
-
84
-
85
-
86
-
87
-
88
-
89
-
90
-
91
-
92
-
93
-
94
-
95
-
96
 |
 |

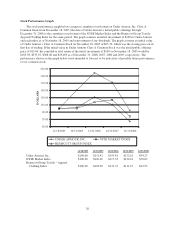
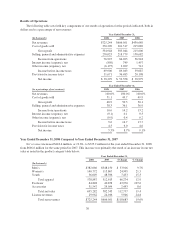
Provision for income taxes increased $16.4 million to $36.5 million for the year ended December 31, 2007
from $20.1 million for the same period in 2006. For the year ended December 31, 2007, our effective tax rate
was 41.0% compared to 34.0% for the same period in 2006. Our annual 2007 effective tax rate is higher than our
2006 annual effective tax rate primarily due to the impact of 2006 state tax credits.
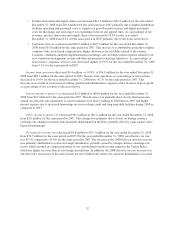
Seasonality
Historically, we have recognized a significant portion of our income from operations in the last two quarters
of the year, driven by increased sales volume of our products during the fall selling season, reflecting our
historical strength in fall sports, and the seasonality of our higher priced COLDGEAR®line. During 2008, a
larger portion of our income from operations was in the last two quarters of 2008 partially due to the shift in the
timing of marketing investments to the first two quarters of 2008 as compared to prior years. The majority of our
net revenues were generated during the last two quarters in each of 2008, 2007 and 2006. The level of our
working capital generally reflects the seasonality and growth in our business. We generally expect inventory,
accounts payable and certain accrued expenses to be higher in the second and third quarters in preparation for the
fall selling season. Nonetheless, the historical high percentage of income from operations and net revenues in the
second half of the year may have been in part due to our growth in net revenues.
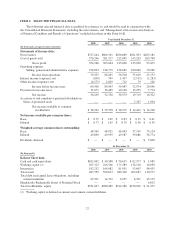
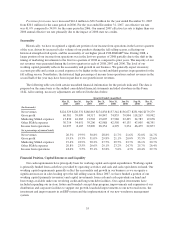
The following table sets forth certain unaudited financial information for the periods indicated. The data is
prepared on the same basis as the audited consolidated financial statements included elsewhere in this Form
10-K. All recurring, necessary adjustments are reflected in the data below.
Quarter Ended (unaudited)
Mar 31,
2007
Jun 30,
2007
Sep 30,
2007
Dec 31,
2007
Mar 31,
2008
Jun 30,
2008
Sep 30,
2008
Dec 31,
2008
(In thousands)
Net revenues $124,329 $120,531 $186,863 $174,838 $157,342 $156,677 $231,946 $179,279
Gross profit 60,581 59,099 94,517 90,847 74,835 70,904 118,267 90,942
Marketing SG&A expenses 13,830 16,283 21,502 19,605 27,986 22,495 24,783 19,678
Other SG&A expenses 30,714 34,651 39,206 42,988 42,550 45,135 47,005 48,391
Income from operations 16,037 8,165 33,809 28,254 4,299 3,274 46,479 22,873
(As a percentage of annual totals)
Net revenues 20.5% 19.9% 30.8% 28.8% 21.7% 21.6% 32.0% 24.7%
Gross profit 19.9% 19.3% 31.0% 29.8% 21.1% 20.0% 33.3% 25.6%
Marketing SG&A expenses 19.4% 22.9% 30.2% 27.5% 29.5% 23.7% 26.1% 20.7%
Other SG&A expenses 20.8% 23.5% 26.6% 29.1% 23.2% 24.7% 25.7% 26.4%
Income from operations 18.6% 9.5% 39.1% 32.8% 5.6% 4.3% 60.4% 29.7%
Financial Position, Capital Resources and Liquidity
Our cash requirements have principally been for working capital and capital expenditures. Working capital
is primarily funded from cash flows provided by operating activities and cash and cash equivalents on hand. Our
working capital requirements generally reflect the seasonality and growth in our business as we recognize a
significant increase in sales leading up to the fall selling season. Since 2007, we have funded a portion of our
working capital (primarily inventory) and capital investments from cash and cash equivalents on hand and
borrowings available under our revolving credit and long term debt facilities. Our capital investments have
included expanding our in-store fixture and branded concept shop program, improvements and expansion of our
distribution and corporate facilities to support our growth, leasehold improvements to our new retail stores, the
investment and improvements in an ERP system and the implementation of our new warehouse management
system.
35