Under Armour 2008 Annual Report Download - page 60
Download and view the complete annual report
Please find page 60 of the 2008 Under Armour annual report below. You can navigate through the pages in the report by either clicking on the pages listed below, or by using the keyword search tool below to find specific information within the annual report.-
 1
1 -
2
-
3
-
4
-
5
-
6
-
7
-
8
-
9
-
10
-
11
-
12
-
13
-
14
-
15
-
16
-
17
-
18
-
19
-
20
-
21
-
22
-
23
-
24
-
25
-
26
-
27
-
28
-
29
-
30
-
31
-
32
-
33
-
34
-
35
-
36
-
37
-
38
-
39
-
40
-
41
-
42
-
43
-
44
-
45
-
46
-
47
-
48
-
49
-
 50
50 -
 51
51 -
 52
52 -
 53
53 -
 54
54 -
 55
55 -
 56
56 -
 57
57 -
 58
58 -
 59
59 -
 60
60 -
 61
61 -
 62
62 -
 63
63 -
 64
64 -
 65
65 -
 66
66 -
 67
67 -
 68
68 -
 69
69 -
 70
70 -
71
-
72
-
73
-
74
-
75
-
76
-
77
-
78
-
79
-
80
-
81
-
82
-
83
-
84
-
85
-
86
-
87
-
88
-
89
-
90
-
91
-
92
-
93
-
94
-
95
-
96
 |
 |

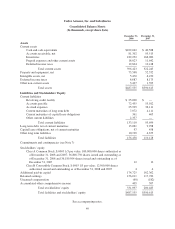
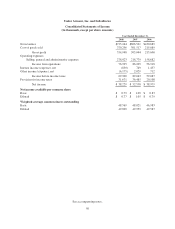
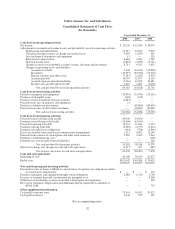
Under Armour, Inc. and Subsidiaries
Consolidated Statements of Cash Flows
(In thousands)
Year Ended December 31,
2008 2007 2006
Cash flows from operating activities
Net income $ 38,229 $ 52,558 $ 38,979
Adjustments to reconcile net income to net cash provided by (used in) operating activities
Depreciation and amortization 21,347 14,622 9,824
Unrealized foreign currency exchange rate (gains) losses 5,459 (2,567) 161
Loss on disposal of property and equipment 15 — 115
Stock-based compensation 8,466 4,182 1,982
Deferred income taxes (2,818) (4,909) (6,721)
Changes in reserves for doubtful accounts, returns, discounts and inventories 8,711 4,551 3,832
Changes in operating assets and liabilities:
Accounts receivable 2,634 (24,222) (20,828)
Inventories (19,497) (83,966) (26,504)
Prepaid expenses and other assets (7,187) (2,067) (3,997)
Accounts payable 16,957 11,873 8,203
Accrued expenses and other liabilities (5,316) 11,825 10,681
Income taxes payable and receivable 2,516 3,492 (5,026)
Net cash provided by (used in) operating activities 69,516 (14,628) 10,701
Cash flows from investing activities
Purchase of property and equipment (38,594) (33,959) (15,115)
Purchase of intangible assets (600) (125) —
Purchase of trust owned life insurance policies (2,893) — —
Proceeds from sales of property and equipment 21 — —
Purchases of short term investments — (62,860) (89,650)
Proceeds from sales of short term investments — 62,860 89,650
Net cash used in investing activities (42,066) (34,084) (15,115)
Cash flows from financing activities
Proceeds from revolving credit facility 40,000 14,000 —
Payments on revolving credit facility (15,000) (14,000) —
Proceeds from long term debt 13,214 11,841 2,119
Payments on long term debt (6,490) (2,973) (2,413)
Payments on capital lease obligations (464) (794) (1,840)
Excess tax benefits from stock-based compensation arrangements 2,131 6,892 11,260
Proceeds from exercise of stock options and other stock issuances 1,990 3,182 3,544
Payments of debt financing costs — — (260)
Payments received on notes from stockholders — — 169
Net cash provided by financing activities 35,381 18,148 12,579
Effect of exchange rate changes on cash and cash equivalents (1,377) 497 (487)
Net increase (decrease) in cash and cash equivalents 61,454 (30,067) 7,678
Cash and cash equivalents
Beginning of year 40,588 70,655 62,977
End of year $102,042 $ 40,588 $ 70,655
Non-cash financing and investing activities
Fair market value of shares withheld in consideration of employee tax obligations relative
to stock-based compensation $ — $ — $ 734
Purchase of property and equipment through certain obligations 2,486 1,110 2,700
Issuance of warrants in partial consideration for intangible asset — — 8,500
Settlement of outstanding accounts receivable with property and equipment — — 350
Reversal of unearned compensation and additional paid in capital due to adoption of
SFAS 123R — — 715
Other supplemental information
Cash paid for income taxes 29,561 30,502 20,522
Cash paid for interest 1,444 525 531
See accompanying notes.
52