TomTom 2014 Annual Report Download - page 92
Download and view the complete annual report
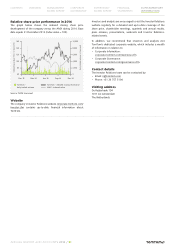
Please find page 92 of the 2014 TomTom annual report below. You can navigate through the pages in the report by either clicking on the pages listed below, or by using the keyword search tool below to find specific information within the annual report.-
 1
1 -
2
-
3
-
4
-
5
-
6
-
7
-
8
-
9
-
10
-
11
-
12
-
13
-
14
-
15
-
16
-
17
-
18
-
19
-
20
-
21
-
22
-
23
-
24
-
25
-
26
-
27
-
28
-
29
-
30
-
31
-
32
-
33
-
34
-
35
-
36
-
37
-
38
-
39
-
40
-
41
-
42
-
43
-
44
-
45
-
46
-
47
-
48
-
49
-
50
-
51
-
52
-
53
-
54
-
55
-
56
-
57
-
58
-
59
-
60
-
61
-
62
-
63
-
64
-
65
-
66
-
67
-
68
-
69
-
70
-
71
-
72
-
73
-
74
-
75
-
76
-
77
-
78
-
79
-
80
-
81
-
 82
82 -
 83
83 -
 84
84 -
 85
85 -
 86
86 -
 87
87 -
 88
88 -
 89
89 -
 90
90 -
 91
91 -
 92
92 -
 93
93 -
 94
94 -
 95
95 -
 96
96
 |
 |
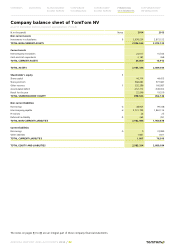
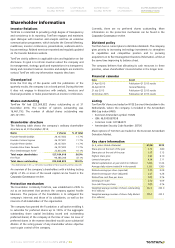
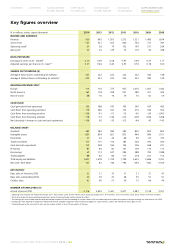
Key figures overview
(€ in millions, unless stated otherwise) 2014 2013 2012 2011 2010 2009 2008
INCOME AND EXPENSES
Revenue 950 963 1,057 1,273 1,521 1,480 1,674
Gross result 523 521 555 640 744 731 781
Operating result121 26 70 102 190 231 264
Net result223 20 129 74 110 94 188
DATA PER SHARE
Earnings per share (in €) - diluted30.10 0.09 0.58 –1.97 0.49 0.47 1.17
Adjusted earnings per share (in €) - basic3 4 0.27 0.26 0.40 0.55 0.70 0.78 1.50
SHARES OUTSTANDING (#)
Average # basic shares outstanding (in millions)3223 222 222 222 222 184 148
Average # diluted shares outstanding (in millions)3225 223 222 222 222 185 149
REGIONAL REVENUE SPLIT
Europe 719 710 773 937 1,070 1,007 1,182
North America 163 178 208 257 380 411 434
Rest of world 68 76 76 79 70 62 59
CASH FLOW
Cash generated from operations 135 188 187 195 265 430 463
Cash flows from operating activities 119 260 167 174 210 340 354
Cash flows from investing activities –106 –91 –51 –73 –65 –90 –1,903
Cash flows from financing activities –118 –74 –146 –214 –209 –206 1,408
Net (decrease) / increase in cash and cash equivalents –106 95 –30 –112 –64 45 –142
BALANCE SHEET
Goodwill 382 382 382 382 855 855 855
Intangible assets 801 804 821 872 946 986 1,011
Inventories 47 42 44 66 94 67 145
Trade receivables 133 115 150 185 306 294 290
Cash and cash equivalents 153 258 164 194 306 368 321
Provisions 83 80 81 101 109 114 113
Borrowings 49 173 247 384 588 790 1,388
Trade payables 88 82 84 117 218 201 152
Total equity and liabilities 1,601 1,678 1,724 1,799 2,623 2,686 2,767
Net cash / (Net debt) 103 83 –86 –194 –294 –442 –1,109
KEY RATIOS5
Days sales of Inventory (DSI) 33 31 30 31 31 21 47
Days sales outstanding (DSO) 46 39 47 48 55 51 51
Creditor days 63 60 57 56 72 64 49
NUMBER OF EMPLOYEES (#)
At end of period (FTE) 4,116 3,630 3,441 3,677 3,487 3,138 3,357
1Operating result excludes the impairment charges (2011: €512 million; 2008: €1,047 million) and restructuring charges (2011: €14.8 million; 2010: €3.3 million; 2009: €10.3 million; 2008: €16.5 million).
2Net result excludes the abovementioned impairment and restructuring charges and the related tax effects.
3The earnings per share number and the weighted average number of shares outstanding for all years before 2009 have been adjusted to reflect the impact of the right offering that took place in July 2009.
4Earnings per share adjusted for acquisition-related amortisation, goodwill impairment and restructuring charges on a post-tax basis, and an €80 million one-off tax gain in 2012.
5Calculated based on the sales/cost of sales and the number of days in the last three months of the year.
CONTENTS OVERVIEW MANAGEMENT
BOARD REPORT CORPORATE
GOVERNANCE SUPERVISORY
BOARD REPORT FINANCIAL
STATEMENTS SUPPLEMENTARY
INFORMATION
ANNUAL REPORT AND ACCOUNTS 2014 / 92