TomTom 2014 Annual Report Download - page 56
Download and view the complete annual report
Please find page 56 of the 2014 TomTom annual report below. You can navigate through the pages in the report by either clicking on the pages listed below, or by using the keyword search tool below to find specific information within the annual report.-
 1
1 -
2
-
3
-
4
-
5
-
6
-
7
-
8
-
9
-
10
-
11
-
12
-
13
-
14
-
15
-
16
-
17
-
18
-
19
-
20
-
21
-
22
-
23
-
24
-
25
-
26
-
27
-
28
-
29
-
30
-
31
-
32
-
33
-
34
-
35
-
36
-
37
-
38
-
39
-
40
-
41
-
42
-
43
-
44
-
45
-
 46
46 -
 47
47 -
 48
48 -
 49
49 -
 50
50 -
 51
51 -
 52
52 -
 53
53 -
 54
54 -
 55
55 -
 56
56 -
 57
57 -
 58
58 -
 59
59 -
 60
60 -
 61
61 -
 62
62 -
 63
63 -
 64
64 -
 65
65 -
 66
66 -
67
-
68
-
69
-
70
-
71
-
72
-
73
-
74
-
75
-
76
-
77
-
78
-
79
-
80
-
81
-
82
-
83
-
84
-
85
-
86
-
87
-
88
-
89
-
90
-
91
-
92
-
93
-
94
-
95
-
96
 |
 |

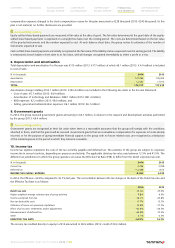
A reconciliation of the segment performance measure (EBIT) to the group's result before tax is provided below.
(€ in thousands) 2014 2013
Total Segment EBIT 29,924 36,561
Unallocated expenses –8,810 –11,015
Interest result –3,145 –2,945
Other finance result –3,720 –1,619
Result of associates 374 3,091
RESULT BEFORE TAX 14,623 24,073
A breakdown of the external revenue to types of products and services and to geographical areas is as follows:
(€ in thousands) 2014 2013
External revenue - by products and services
Sale of goods1578,086 592,834
Rendering of content and services 188,600 190,072
Royalty revenue 183,606 180,548
TOTAL 950,292 963,454
1Includes navigation software, map and traffic components sold initially in bundle with the Automotive hardware.
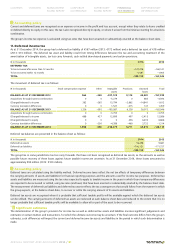
(€ in thousands) 2014 2013
External revenue - by geographical areas
Europe 718,767 710,101
North America 163,461 177,725
Rest of world 68,064 75,628
TOTAL 950,292 963,454
The geographical split of the group's revenue from sale of goods and content and services is based on the location of the customers, while
the split for royalty revenue is based on the coverage of the group's geographical map data and other contents.
Total revenue generated in the Netherlands during 2014 amounted to €74 million (2013: €60 million).
The group has no significant concentration of sales from a particular individual external customer.
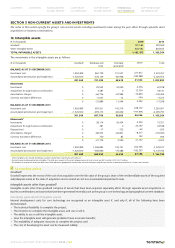
The non-current assets within the group include a significant portion of the carrying value of the step up resulting from the Tele Atlas acquisition
in 2008. As this step up is not geographically allocated to the respective regions for internal management reporting, it is believed that disclosure
of geographic allocation would be highly judgemental and would not give a true representation of geographical spread of the group's assets.
Accounting policy
Revenue is measured at the fair value of the consideration received or receivable and represents amounts receivable for products and/or
services delivered in the normal course of business. Revenue is reduced for estimated probable customer returns, rebates and other similar
allowances whenever applicable.
The revenue recognition policy for each type of revenue or their combination is presented below:
Sale of goods
Revenue from the sale of goods is only recognised when the risks and rewards of ownership of goods are transferred to the customers, which
include distributors, retailers, end users and OEMs. The risks and rewards of ownership are generally transferred at the time the product is
shipped and delivered to the customer and, depending on the delivery conditions, title and risk have passed to the customer and acceptance
of the product, when contractually required, has been obtained. In cases where contractual acceptance is not required, revenue is recognised
when management has established that all aforementioned conditions for revenue recognition have been met.
Royalty revenue
Royalty revenue is generated through licensing of geographic and/or other traffic-/location-based content to customers. Revenue is recognised
on an accrual basis based on the contractual terms and substance of the relevant arrangements with the customers.
Sale of services
Services revenue is generated from the sale of traffic and map update services, content sales, connected navigation and fleet management
services to commercial fleets. The revenue relating to the service element is recognised over the agreed or estimated service period on a
straight-line basis. In arrangements where devices are rented out to the customer in Telematics, the rental revenue is included in the revenue
from subscriptions.
Multiple-element arrangements
The group's product and services offerings include arrangements that require the group to deliver equipment (e.g. navigation hardware) and/
or a number of services (e.g. map update services) under one agreement, or under a series of agreements that are commercially linked (referred
to as 'multiple-element arrangements'). In such multiple-element arrangements, the consideration received is allocated to each separately
CONTENTS OVERVIEW MANAGEMENT
BOARD REPORT CORPORATE
GOVERNANCE SUPERVISORY
BOARD REPORT FINANCIAL
STATEMENTS SUPPLEMENTARY
INFORMATION
ANNUAL REPORT AND ACCOUNTS 2014 / 56