TomTom 2014 Annual Report Download - page 50
Download and view the complete annual report
Please find page 50 of the 2014 TomTom annual report below. You can navigate through the pages in the report by either clicking on the pages listed below, or by using the keyword search tool below to find specific information within the annual report.-
 1
1 -
2
-
3
-
4
-
5
-
6
-
7
-
8
-
9
-
10
-
11
-
12
-
13
-
14
-
15
-
16
-
17
-
18
-
19
-
20
-
21
-
22
-
23
-
24
-
25
-
26
-
27
-
28
-
29
-
30
-
31
-
32
-
33
-
34
-
35
-
36
-
37
-
38
-
39
-
 40
40 -
 41
41 -
 42
42 -
 43
43 -
 44
44 -
 45
45 -
 46
46 -
 47
47 -
 48
48 -
 49
49 -
 50
50 -
 51
51 -
 52
52 -
 53
53 -
 54
54 -
 55
55 -
 56
56 -
 57
57 -
 58
58 -
 59
59 -
 60
60 -
61
-
62
-
63
-
64
-
65
-
66
-
67
-
68
-
69
-
70
-
71
-
72
-
73
-
74
-
75
-
76
-
77
-
78
-
79
-
80
-
81
-
82
-
83
-
84
-
85
-
86
-
87
-
88
-
89
-
90
-
91
-
92
-
93
-
94
-
95
-
96
 |
 |

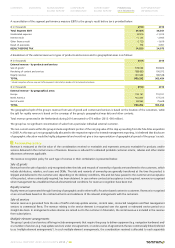
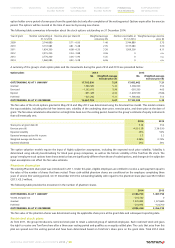
Consolidated statement of cash flows
for the year ended 31 December
(€ in thousands) Notes 2014 2013
Operating result 21,114 25,546
Financial (losses) –1,956 –7,757
Depreciation and amortisation 8 114,711 117,419
Equity-settled stock compensation expense 7 4,126 4,440
Change in provisions –3,702 –5,285
Change in working capital:
Change in inventories –3,549 3,753
Change in receivables and prepayments –11,592 33,059
Change in current liabilities (excluding provisions)115,568 16,861
CASH GENERATED FROM OPERATIONS 134,720 188,036
Interest received 30 1,467 1,139
Interest paid 30 –3,817 –2,863
Corporate income taxes (paid) / received –13,741 73,196
CASH FLOWS FROM OPERATING ACTIVITIES 118,629 259,508
Investments in intangible assets 12 –72,700 –68,414
Investments in property, plant and equipment 13 –16,564 –16,184
Acquisitions of subsidiaries and other businesses 15 –17,280 –6,942
Dividend received 16 58 1,036
CASH FLOWS FROM INVESTING ACTIVITIES –106,486 –90,504
Repayment of borrowings 27 –175,000 –75,000
Amount utilised from credit facility 27 50,000 0
Dividends paid –177 –377
Proceeds on issue of ordinary shares 7 6,794 1,508
CASH FLOWS FROM FINANCING ACTIVITIES –118,383 –73,869
NET (DECREASE) / INCREASE IN CASH AND CASH EQUIVALENTS –106,240 95,135
Cash and cash equivalents at the beginning of period 257,785 164,459
Effect of exchange rate changes on cash balances held in foreign currencies 1,404 –1,809
CASH AND CASH EQUIVALENTS AT THE END OF PERIOD 152,949 257,785
1Includes movements in the non-current portion of deferred revenue presented under Non-current liabilities.
The notes on pages 52 to 80 are an integral part of these consolidated financial statements.
CONTENTS OVERVIEW MANAGEMENT
BOARD REPORT CORPORATE
GOVERNANCE SUPERVISORY
BOARD REPORT FINANCIAL
STATEMENTS SUPPLEMENTARY
INFORMATION
ANNUAL REPORT AND ACCOUNTS 2014 / 50