TomTom 2014 Annual Report Download - page 65
Download and view the complete annual report
Please find page 65 of the 2014 TomTom annual report below. You can navigate through the pages in the report by either clicking on the pages listed below, or by using the keyword search tool below to find specific information within the annual report.-
 1
1 -
2
-
3
-
4
-
5
-
6
-
7
-
8
-
9
-
10
-
11
-
12
-
13
-
14
-
15
-
16
-
17
-
18
-
19
-
20
-
21
-
22
-
23
-
24
-
25
-
26
-
27
-
28
-
29
-
30
-
31
-
32
-
33
-
34
-
35
-
36
-
37
-
38
-
39
-
40
-
41
-
42
-
43
-
44
-
45
-
46
-
47
-
48
-
49
-
50
-
51
-
52
-
53
-
54
-
 55
55 -
 56
56 -
 57
57 -
 58
58 -
 59
59 -
 60
60 -
 61
61 -
 62
62 -
 63
63 -
 64
64 -
 65
65 -
 66
66 -
 67
67 -
 68
68 -
 69
69 -
 70
70 -
 71
71 -
 72
72 -
 73
73 -
 74
74 -
 75
75 -
76
-
77
-
78
-
79
-
80
-
81
-
82
-
83
-
84
-
85
-
86
-
87
-
88
-
89
-
90
-
91
-
92
-
93
-
94
-
95
-
96
 |
 |

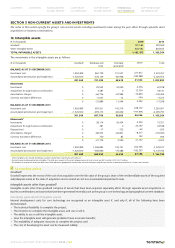
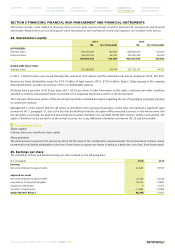
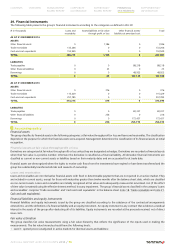
A segment-level summary of the goodwill allocation for the group's segments in 2014 and 2013 is presented below:
(€ in thousands) 2014 2013
Consumer 168,687 168,687
Automotive 83,389 83,389
Licensing 85,217 85,217
Telematics 44,276 44,276
TOTAL 381,569 381,569
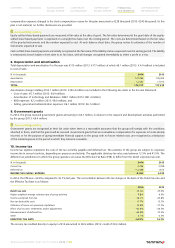
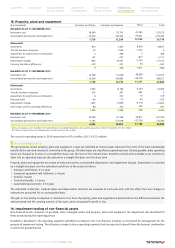
Accounting policy
Assets, such as goodwill, that have an indefinite useful life, which are not subject to amortisation, and intangible assets not yet ready to use
are tested for impairment at least annually, or whenever management identifies conditions that may trigger a risk of impairment. Assets that
are subject to amortisation/depreciation are tested for impairment whenever events or changes in circumstances indicate that the carrying
amount may not be recoverable. For the purposes of assessing impairment, assets are grouped at the lowest levels for which there are
separately identifiable cash flows (cash-generating units).
An impairment loss is recognised for the amount by which the asset's carrying amount exceeds its recoverable amount and is recognised
immediately in the income statement. The recoverable amount is the higher of an asset's fair value less costs of disposal and value in use. In
estimating the recoverable amount, management is required to make an estimate of the expected future cash flows from the cash-generating
unit in the forecasted period and also to determine a suitable discount rate in order to calculate the present value of those cash flows. Such
estimates might be subject to a certain degree of judgement and uncertainty.
Non-financial assets, other than goodwill, which have been subject to an impairment, are reviewed for possible reversal of the impairment
at each reporting date.
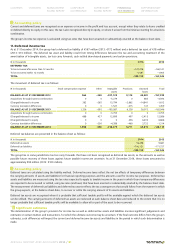
Significant estimates
Impairment test for goodwill
The recoverable amount of a segment is determined based on the higher of the value in use or fair value less costs of disposal calculations.
The fair value less costs of disposal calculation resulted in a higher recoverable amount.
The calculations of fair value less costs of disposal use post-tax cash flow projections based on financial forecasts approved by management
covering a five-year period (forecasted period). Management's cash flow projections for each of the segments in the forecasted period are
based on management's assumptions on the expected revenue growth rate, gross margin and operating margin after allocation of operating
expenses from shared units, taking into account management's expectation of market size and market share development.
The revenue projections of Consumer and Licensing in the forecasted period show a single digit growth rate, while Automotive and Telematics
revenues are projected to grow significantly throughout the forecasted period. Given the limited visibility on the longer-term growth, these
growth rates do represent a higher level of uncertainty versus the earlier years. Gross margin and operating margin projections of each of the
segments are consistent with the expected revenue developments. The growth rates after the forecasted period as well as the discount rate
used for each of the segments are presented in the table below. The input to the group's key assumptions include those that are based on
non-observable market data (level 3 input in accordance with IFRS 13).
Consumer Automotive Licensing Telematics
2014
Revenue - perpetual growth10.0% 2.0% 0.0% 2.0%
Discount rate29.5% 9.5% 9.5% 9.5%
2013
Revenue - perpetual growth10.0% 1.0% 0.0% 2.0%
Discount rate210.0% 10.0% 10.0% 10.0%
1Weighted average growth rate used to extrapolate cash flows beyond the forecasted period.
2Post-tax discount rate applied to the cash flow projections.
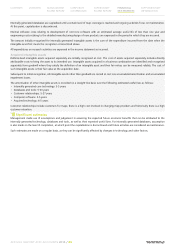
Discount rates used are post-tax and reflect specific risks relating to the relevant operating segments. Management considered the effects of
applying a pre-tax approach and concluded that this will not materially change the outcome of the impairment test.
Expectations and input to the impairment calculation, as well as the overall outcome, have been compared with the available external
information from various analysts and to the extent available with market information on recent comparable transactions.
The impairment test performed resulted in no goodwill impairment for 2014 and 2013 for any of the segments.
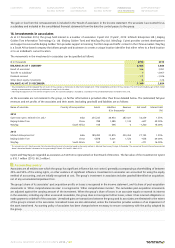
Management performed a sensitivity analysis on the relevant key assumptions in the group's 2014 year-end annual impairment testing.
The sensitivity test for the Automotive segment showed that the level of headroom available at year end 2014 (headroom: €41 million, 2013:
€52 million) would fall to nil should the compound annual revenue growth rate in the forecasted period decrease from 16.5% to 14.1% or
if the discount rate increases from 9.5% to 10.2% while other factors remain constant.
CONTENTS OVERVIEW MANAGEMENT
BOARD REPORT CORPORATE
GOVERNANCE SUPERVISORY
BOARD REPORT FINANCIAL
STATEMENTS SUPPLEMENTARY
INFORMATION
ANNUAL REPORT AND ACCOUNTS 2014 / 65